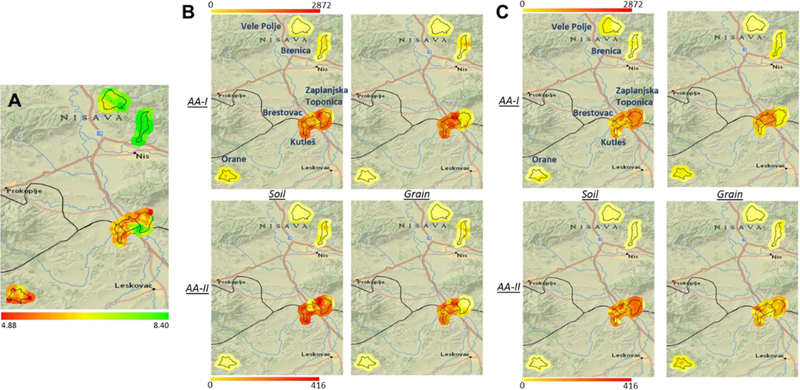
Figure 4.
Relationships among (A) soil pH and AA levels in soil and crops from (B) wheat and (C) maize fields in Serbian villages endemic for Aristolochia plants (Kutleš, Brestovac, Zaplanjska Toponica) and non-endemic villages (Vele Polje, Brenica, Orane). Soil pH and concentrations of spots nearby are estimated using inverse distance weighted interpolation method. Color scales below each map are geometric intervals with eight classes showing the range of values of soil pH (4.88 to 8.40), and AA-I (0 to 2872 ng/g) and AA-II (0 to 416 ng/g) concentrations.

