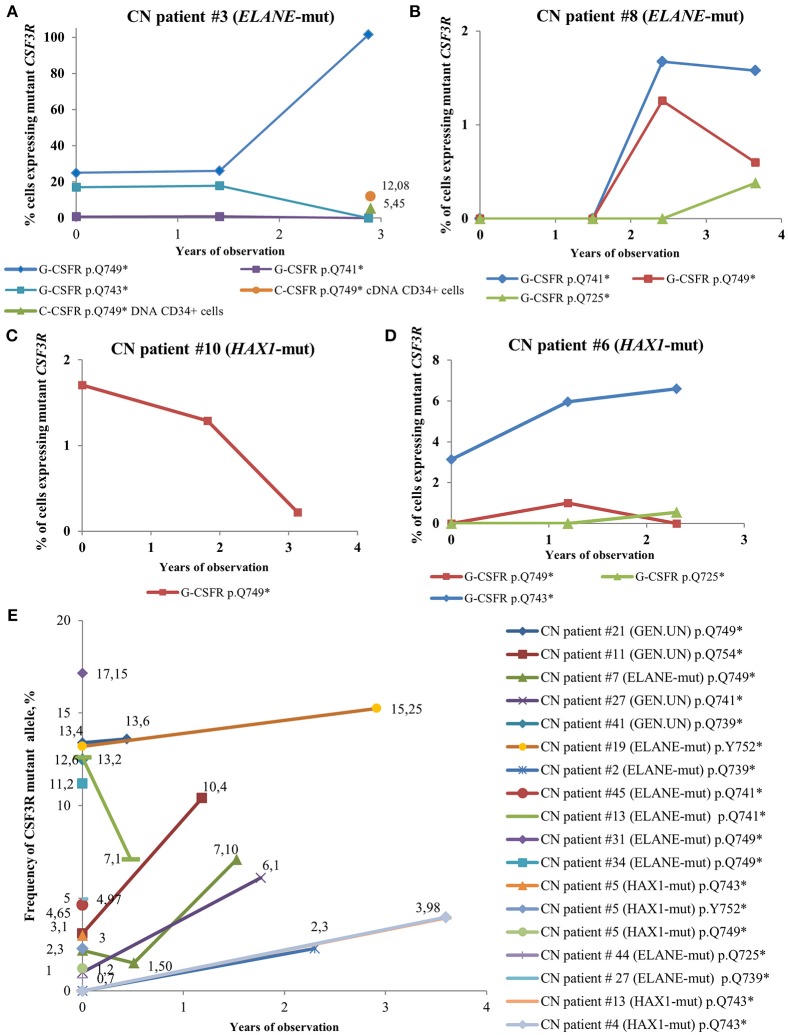
Figure 4.
Time-course of CSF3R mutations in sequential samples from CN patients detected by cDNA and DNA deep sequencing. (A–D) The percentage of cells expressing mutant CSF3R at different time points (in years), starting from the date of the first CSF3R mutation analysis in a given patient, is plotted. All mutations are considered to be heterozygous. The CSF3R mutant clones are indicated based on the relative amino acid positions of mutation sites. The number of cells with CSF3R mutation is estimated to be twice the number of reads supporting a mutant allele, *- stop codon. (E) Time-course of CSF3R mutations occurrence and frequency of mutant alleles in DNA samples from CN patients detected by CSF3R DNA deep sequencing. The frequency of mutant alleles at different time points (in years) in a given patient is plotted. The number of cells with CSF3R mutation is estimated to be twice the number of reads supporting a mutant allele, *- stop codon.

