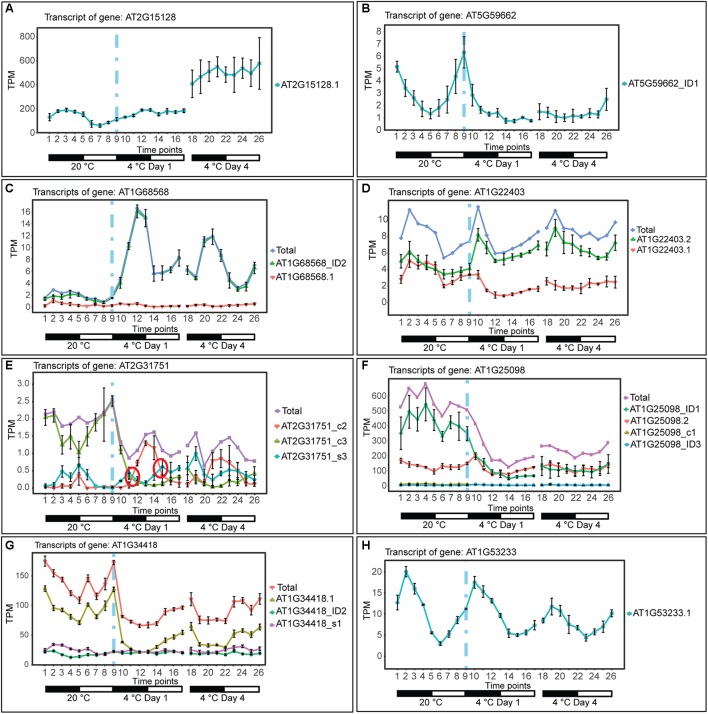
Figure 2.
Expression of lncRNA transcripts in response to cold. Transcripts below 1.85 TPM in all time-points are not shown (except in E, where we used a 0.5 TPM cut-off value). Transition to cold is represented by a vertical dashed blue line at time-point 9. (A) The single transcript of AT2G15128 is DE showing a significant upregulation upon long exposure to cold. (B) AT5G59662_ID1 transcript is DE showing a significant downregulation upon cold and loss of a high amplitude rhythm is also observed. (C) The AT1G68568_ID2 transcript is DE showing a significant upregulation throughout the cold treatment and a gain of a high amplitude rhythm is also observed. (D) AT1G22403 (DAS-only) undergoes splicing regulation rapidly in the cold and the relative abundance of the AT1G22403.2 transcript is maintained in day 4 at 4°C (adaptive) whereas the total gene level is not significantly affected by cold. (E) AT2G31751 and (F) AT1G25098 are DE and DAS showing a significant downregulation upon cold. (G) AT1G34418 (DAS-only) undergoes only significant splicing regulation showing a rapid decrease in abundance of AT1G34418.1 and increasing expression during the day. (H) Rhythmic expression of AT1G53233 (not affected by cold). Rapid and significant isoform switches detected by TSIS (Guo et al., 2017) are labeled with a red circle. NAT lncRNA genes (B,C,E,F,H); sORF (G); other RNA (A,D).

