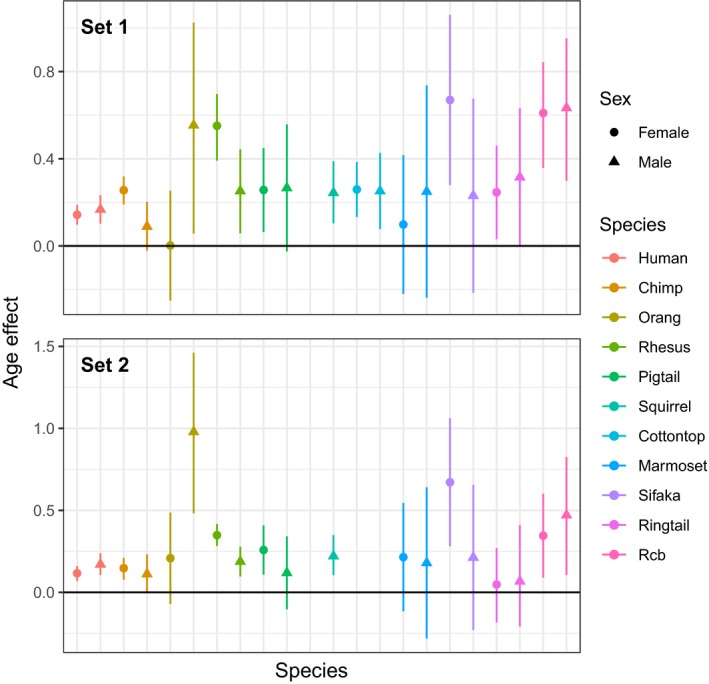
Figure 1.

Estimated effects of age on DM, shown separately by species and sex. DM and age were centered to 0 and scaled to 1 standard deviation. Thus, the coefficient reflects the estimated effect at the mean age, and effect sizes can be compared across species. Error bars represent 95% confidence intervals. Note that this is a graphical representation of separate effects by sex, but significance of effects is interpreted from full model results (see Table S3)
