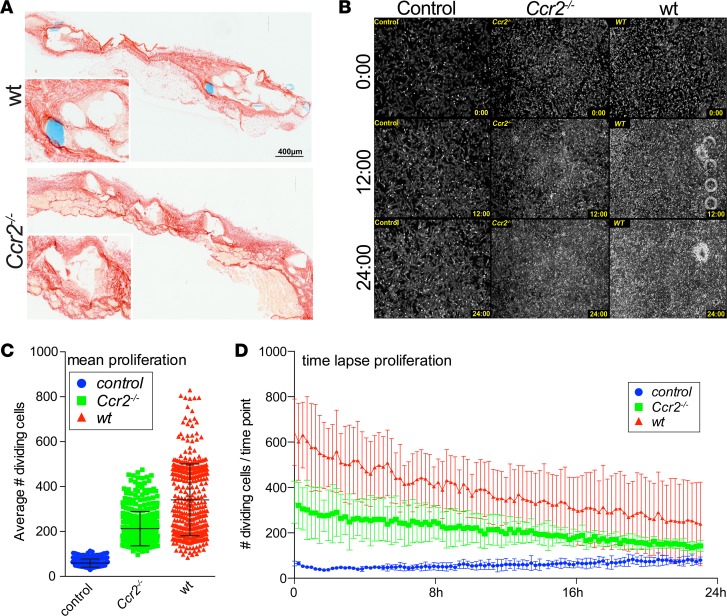
Figure 8. Loss of CCR2 impairs fibroblast growth but does not hamper wound healing following mesh implantation.
(A) Sirius red staining of mesh explants isolated from WT and Ccr2–/– mice on day 21 after implantation. Inset images show magnified mesh-surrounding extracellular matrix. Scale bar: 400 μm; ×2 (inset). (B–D) In vitro fibroblast activation by mesh-explanted tissue. 5 × 10⁴ NIH/3T3 fibroblasts were plated and grown for 12 hours initially. 0.5 cm2 explanted mesh derived from WT and Ccr2–/– mice isolated on day 21 after implantation was added to the cell cultures, and cells were allowed to grow for another 12 hours. Fibroblast activation was determined by in vitro time-lapse microscopy. (B) Phase-contrast images of fibroblast cell cultures. Cells were imaged continuously for a time period of 24 hours, showing control cells without addition of mesh explants (left) and cells in coculture with mesh tissue derived from Ccr2–/– mice (middle) and from WT control animals (right). (C and D) Statistical analysis of cell division detected by phase-contrast changes visualized in B. Cell division was calculated, determining the statistical mean of dividing cells visible in each time point (C) and also displayed over time (D) for control cells (blue), cells cultured with tissue from Ccr2–/– mice (green), and WT control mesh tissue (red). Error bars represent mean ± SD.

