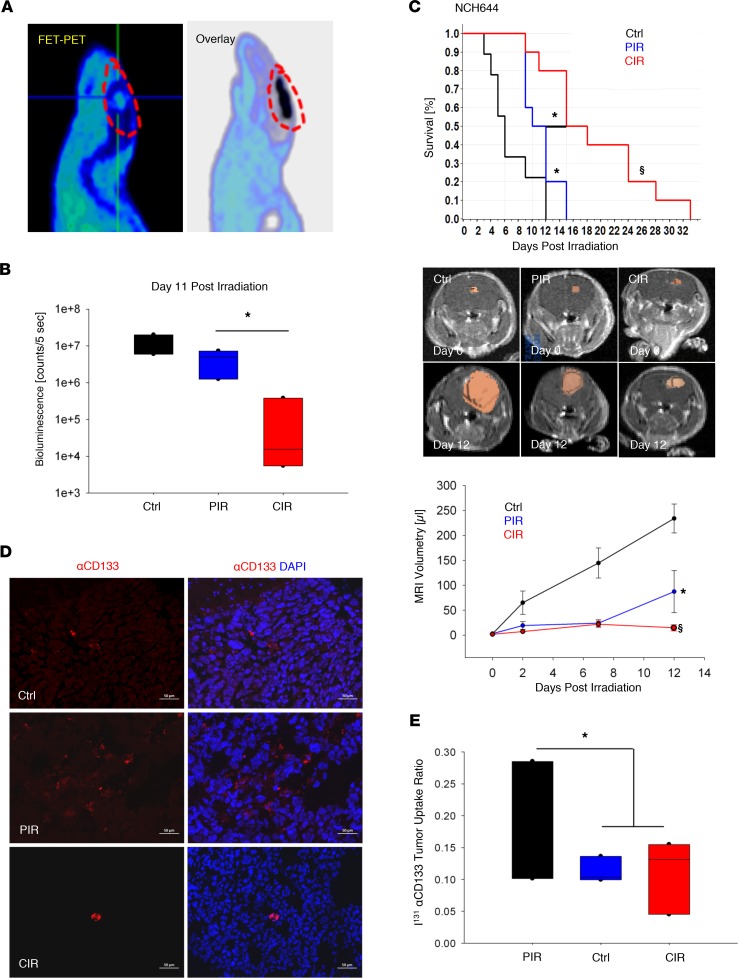
Figure 1. Effect of CIR on patient-derived, GSC-enriched xenograft models.
Establishment of small animal CIR in orthotopic glioma models. (A) Verification of administered dose by overlay of CIR-induced secondary positrons (C11 micro-PET, black) and tumor uptake of 18F-fluoro-ethyl-tyrosine (FET) PET, circled in red at the intersection of the horizontal and vertical lines, indicating precision treatment. (B) Significant inhibition of tumor growth after CIR (5 × 1.5 Gy) versus PIR (5 × 5 Gy) and sham-treated control in an orthotopic xenograft model derived from patient NCH441 GSCs (n = 3). Tumor growth was monitored longitudinally by bioluminescence (see also supplemental material). Ctrl: control. (C) CIR (6 Gy, n = 10) significantly prolonged animal survival compared with PIR (15 Gy, n = 10), both administered in 3 consecutive daily fractions in the NCH644 GSC model. Kaplan-Meier survival estimates and tumor growth kinetic via MRI-based tumor volumetry are shown. (D and E) PIR (n = 5) led to a relative enrichment of the GSC population compared with control (n = 3) and CIR (n = 5) as determined by NCH644 tumor I131α-CD133 uptake ratio and biodistribution studies (supplemental material). The lack of selection for α-CD133+ GSCs (red) is also elucidated by representative immunofluorescence staining. Nuclei counterstained using DAPI (blue). Box and whisker plots represent median, interquartile, minimum, and maximum of all data points. §P < 0.0001, *P < 0.05 versus control, when shown over a box, or versus the indicated irradiation treatment. Scale bar: 50 μm.

