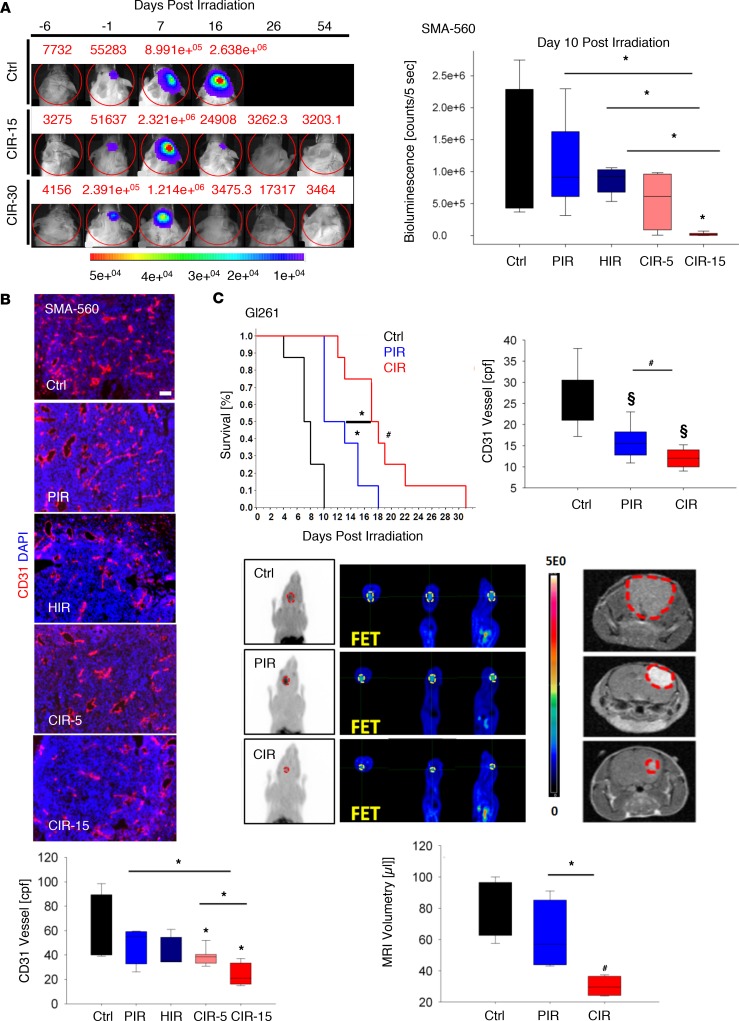
Figure 2. Beneficial effect of CIR in syngeneic, orthotopic murine models.
(A) Comparison of PIR, HIR, and CIR in an intracranial syngeneic SMA-560 murine glioma model. Tumor control at single doses ≥ 15-Gy CIR was observed. Tumor growth (n = 2/study arm) was longitudinally monitored by bioluminescence at –6, –1, 7, 16, 26, and 54 days after irradiation. Next, SMA-560 tumors were irradiated with 15-Gy PIR (n = 12), 15-Gy HIR (n = 12), 15-Gy CIR (CIR-15, n = 12), or 5-Gy CIR (CIR-5, n = 12). Tumor growth inhibition was significant only for the CIR-15 group versus all other arms at day 10 after irradiation as determined by bioluminescence. Representative photomicrographs of tumor vascular staining by anti-endothelial CD31 marker (red) are shown. (B) Nuclei counterstained using DAPI (blue). cpf, counts per field. (C) Likewise, in the Gl261 glioma model, irradiation with 6-Gy CIR significantly prolonged survival (control n = 8, PIR n = 8, CIR n = 8) compared with 15-Gy PIR, both administered in 3 consecutive daily fractions. This effect also correlated with reduced microvascular density (MVD) (n = 6/study arm), metabolism by micro–FET PET imaging (tumor margins delineated in yellow), and tumor size measured by volumetry using T1-weighted contrast-enhanced (T1CE) MRI (n = 4) (hyperintense gross tumor area is contoured by red dashed lines).Bioluminescence, MRI tumor volumes, and CD31+ blood vessels per field data are represented as box-and-whisker plots showing median, interquartile, the minimum and maximum of all data points. §P < 0.0001, #P < 0.001, *P < 0.05 versus control, when shown over a box, or versus the indicated irradiation treatment. Scale bar: 50 μm.

