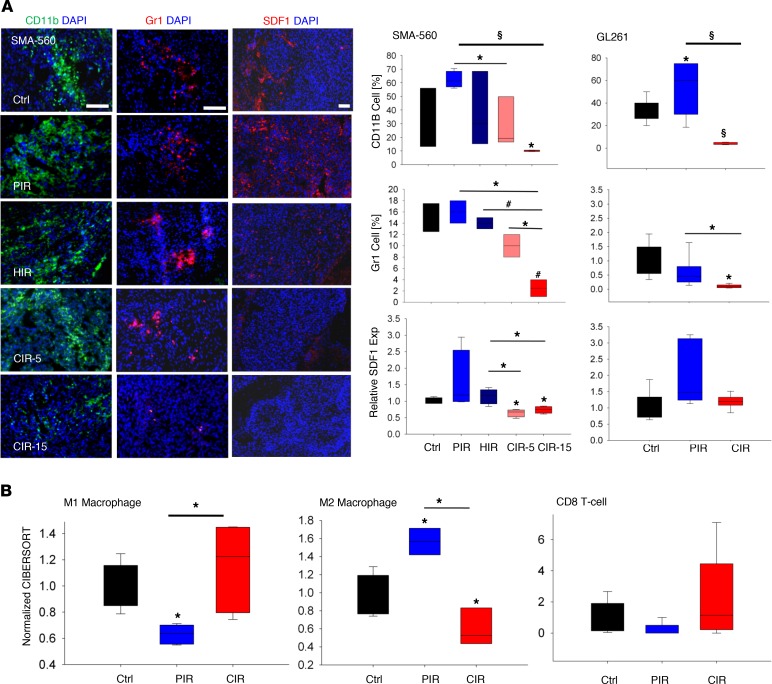
Figure 4. CIR generates an immunopermissive glioma niche.
(A) In line with these observations, reduced influx of CD11b+ microglia and myeloid cells, including Gr1+ MdSCs, after CIR was confirmed and correlated with decreased SDF1 levels (SMA-560 n = 3–4, Gl261 n = 6). Exp: expression. (B) In silico cell sorting identified a switch in macrophages/microglia polarization toward an M2 phenotype after PIR, which was accompanied by reduced abundance of CD8+ T cells (control n = 5, PIR n = 3–5, CIR n = 3–5). However, a reverse trend was found after CIR, indicating lack of immunosuppressive signal and accelerated glioma immunity. Box and whisker plots represent median, interquartile, minimum, and maximum of all data points. §P < 0.0001, #P < 0.001, *P < 0.05 versus control, when shown over a box, or versus the indicated irradiation treatment. Scale bar: 50 μm (CD11b, Gr1).

