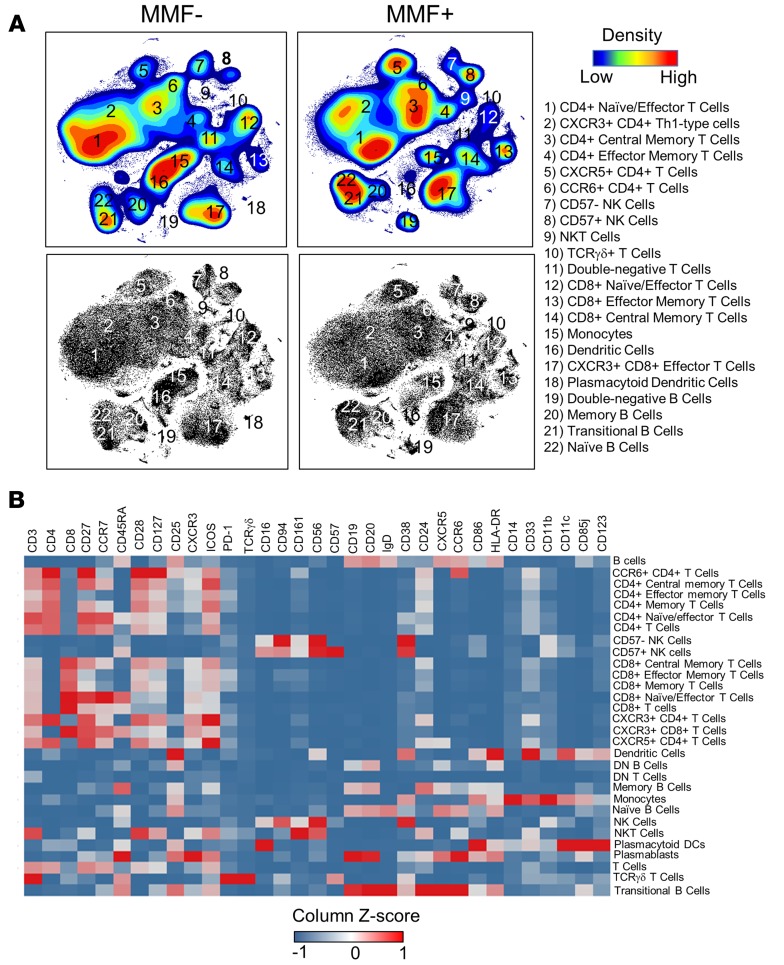
Figure 1. t-SNE analysis pipeline identifies 22 phenotypically distinct populations in PBMCs.
(A) Dimensionality-reduced t-SNE plots (using 33 surface markers) from concatenated PBMC data (110,000 cells) of MMF+ or MMF– SLE patients are shown by density maps and dot plots. Clusters are numbered and described by phenotypic subtype. All plots were derived from 10 individuals in the MMF– group and 5 individuals in the MMF+ group. (B) A heatmap summary of the expression values of all 33 cell surface markers are used to distinguish identified cell subsets. Marker values are displayed on a color scale ranging from blue (levels below the mean) through white (levels equal to the mean) to red (levels greater than the mean) using a column Z score.

