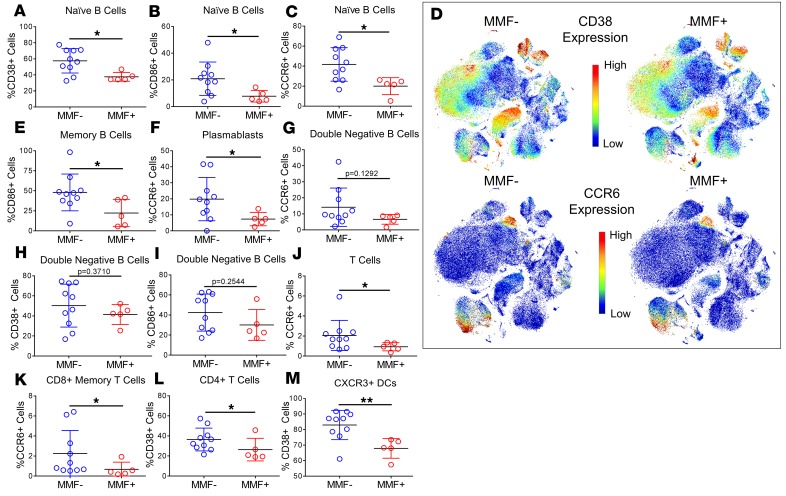
Figure 3. Cell subset marker expression reveals activated B cell, T cell, and DC subsets, and elevated CCR6 expression in MMF+ SLE patients.
All 55 cell subsets as determined by manual gating were assessed for frequencies of activating, inhibitory, and chemokine receptors. Significant differences in cell surface marker expression are highlighted in MMF– (n = 10) and MMF+ SLE patients’ (n = 5) (A) naive B cells (CD38), (B) naive B cells (CD86), (C) naive B cells (CCR6), (E) memory B cells (CD86), and (F) plasmablasts (CCR6). Nonsignificant differences were found in expression on double-negative B cells of (G) CCR6, (H) CD38, and (I) CD86. Significant differences in expression were also found in (J) T cells (CCR6), (K) CD8+ memory T cells (CCR6), (L) CD4+ T cells (CD38), and (M) CXCR3+ DCs (CD38). Concatenated files of MMF– patients (n = 10) and MMF+ patients (n = 5) were used to create t-SNE dot plots individually colored by channel using arcsinh(5)-transformed expression values for (D) CD38 and CCR6. Cell orientations for the t-SNE plots in D can be found in Figure 1. *P < 0.05, **P < 0.01 by Kruskal-Wallis test with Dunn’s multiple comparisons test. Median ± standard deviation shown.

