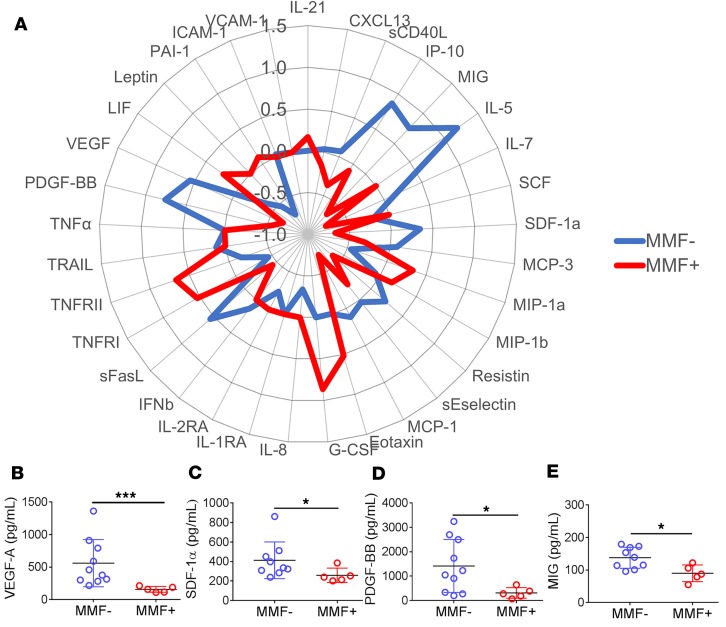
Figure 4. Growth factor and chemokine downregulation distinguish MMF+ SLE patients from MMF– patients.
Proinflammatory soluble mediators (38 total) were measured by multiplex or ELISA. Overall trends in relative plasma soluble mediator levels are depicted by (A) radar plot using the group median Z scores. MMF– SLE patients (n = 10) are highlighted in blue and MMF+ SLE patients (n = 5) are in red. Soluble mediators are represented by dot plots and include (B) VEGF, (C) PDGF-BB, (D) SDF-1α/CXCL12, and (E) MIG/CXCL9. *P < 0.05, ***P < 0.001 by Kruskal-Wallis test with Dunn’s multiple comparisons test. Median ± standard deviation shown.

