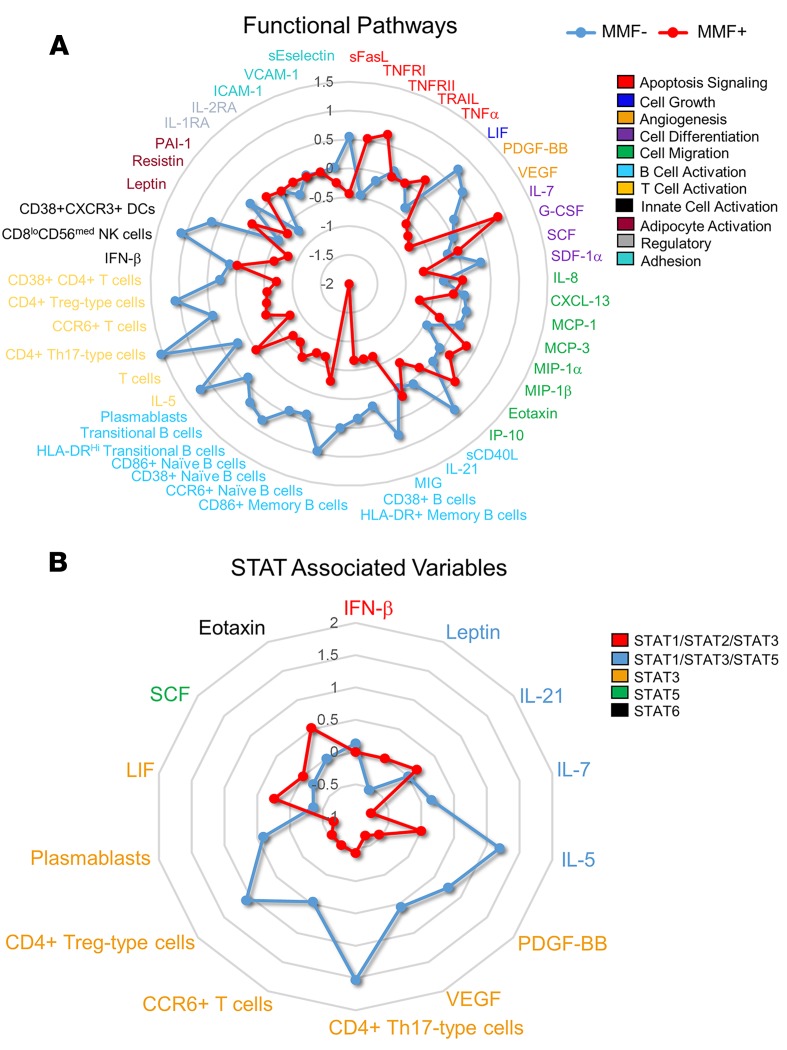
Figure 5. Downregulation of B and T cell activation and STAT3-associated pathways distinguish MMF+ SLE patients from MMF– SLE patients.
A radar plot using the group median of the variable converted to Z scores show significant differences between MMF– SLE patients (n = 10) (blue) and MMF+ SLE patients (n = 5) (red). Cytokines, chemokines, and significant cell numbers and frequencies were grouped according to functional properties (A) or STAT-associated pathways (B).

