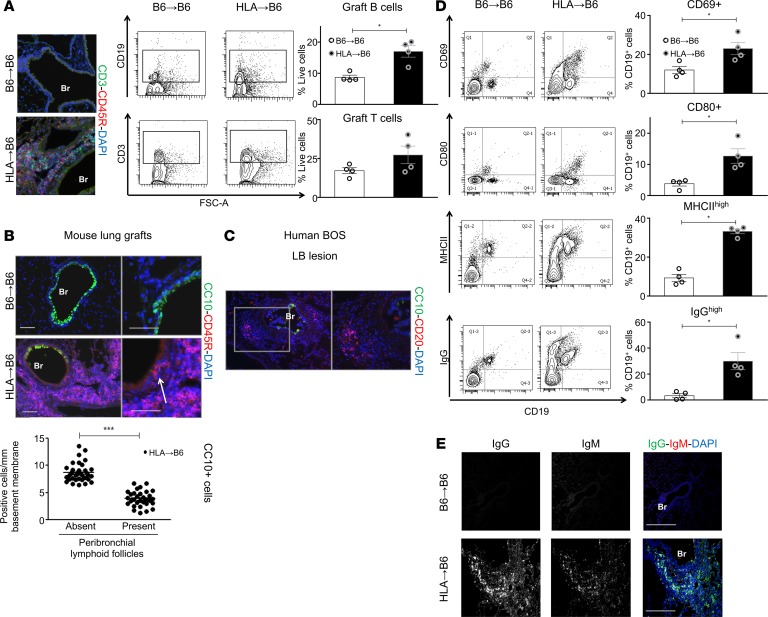
Figure 2. HLA-A2–knockin lung allografts contain follicles and activated B cells.
Left lungs from C57BL/6J (B6) and HLA-A2–knockin (HLA) mice on a B6 background (HLA) were orthotopically transplanted into B6 recipient mice and analyzed 2 months after LTx (B6→B6, n = 4, HLA→B6, n = 4). (A) Representative immunofluorescence staining: 2 months after LTx, lungs of the indicated mice were stained for the T cell marker CD3 (green), the B cell marker CD45R (83), and counterstained with the nuclear marker DAPI. CD3+ and CD19+ cells infiltrating the grafts, analyzed by flow cytometry (FACS), 2 months after LTx. Representative FACS plots and quantification of CD3+ and CD19+ cells, as percentage of live cells, are shown. Data are expressed as mean ± SEM and were analyzed with a Mann-Whitney test; *P < 0.05. (B) Representative images of double immunofluorescence staining for the club cell marker CC10 (green) and the B cell marker CD45R (83) of the indicated mice, 2 months after LTx. Scale bars: 100 μm. (C) Representative images of double immunofluorescence staining for the club cell marker CC10 (green) and the B cell marker CD20 (83) of a lymphocytic bronchiolitis (LB) lesion from human BOS explant. (D) Flow cytometry analysis of the B cell activation markers CD69, MHCII, CD80, and IgG. Left: Representative FACS plots of the above-listed surface markers, gated on CD19+ cells, of the indicated mice. Right: Quantification of the indicated cell populations, expressed as percentage of CD19+ cells. Data are expressed as mean ± SEM and were analyzed with a Mann-Whitney test; *P < 0.05. (E) Representative images of double immunofluorescence staining for IgM (83) and IgG (green) of the indicated mice, 2 months after LTx. Indicated separated fluorescence channels and merged images are presented. Scale bars: 100 μm. Br, bronchus.

