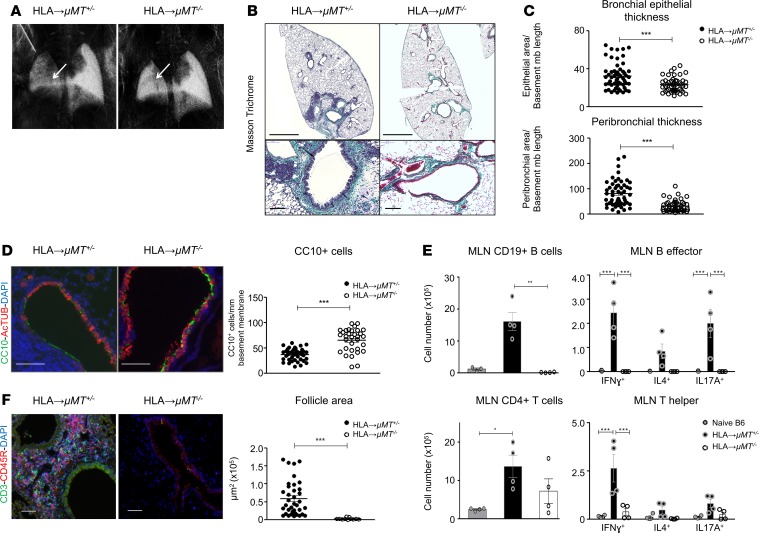
Figure 3. B cell deficiency of the recipient mouse protects for chronic lung allograft rejection.
Left lungs from HLA-A2–knockin mice on a B6 background (HLA) were orthotopically transplanted into μMT+/– control or μMT–/– recipient mice, both on a B6 background. The mice were analyzed 2 months after orthotopic left lung transplantation (LTx) (HLA→μMT+/–, n = 4, HLA→μMT–/–, n = 4). (A) Lungs from indicated mice acquired with the x-ray dark-field imaging technique. Arrows point toward the left lung graft. (B) Representative scans (original magnification, ×2; scale bars: 1000 μm) and zoomed bronchi (original magnification, ×20; scale bars: 100 μm) from indicated transplanted mice, stained with Masson’s trichrome. (C) Quantification of the epithelial area and peribronchial area of the indicated mice. Data are expressed as mean ± SEM of all the quantified bronchi and were analyzed with a 2-way ANOVA with a Bonferroni post-test; ***P < 0.001. (D) Double immunofluorescence for CC10+ club cells (83) and AcTUB+ ciliated cells (green) of the indicated mice, 2 months after LTx. Scale bars: 100 μm. Br, bronchus; V, vessel. Quantification of the CC10+ and AcTUB+ cells, expressed as mm of bronchial basement membrane. Data are expressed as mean ± SEM of all the quantified bronchi and were analyzed with a Mann-Whitney test; ***P < 0.001. (E) Mediastinal lymph nodes (MLN) were mechanically dissociated, stimulated ex vivo with anti-CD3/CD28 (for T helper responses) or anti-CD40+LPS (for B effector responses), and analyzed by FACS after surface or surface and intracellular staining. Top left: CD19+ B cells. The data were analyzed with a 1-way ANOVA with a Kruskal-Wallis post-test; **P < 0.01. Top right: CD19+ B cells producing IFN-γ, IL-4, and IL-17A. Data were analyzed with a 2-way ANOVA followed by a Bonferroni post-test; ***P < 0.001. Bottom left: CD4+ T cells. The data were analyzed with a 1-way ANOVA with a Kruskal-Wallis post-test; * P < 0.05. Bottom right: CD4+ T cells producing IFN-γ, IL-4, and IL-17A (respectively reflecting Th1, Th2, and Th17 populations). The data were analyzed with a 2-way ANOVA with a Bonferroni post-test; ***P < 0.001. (F) Double immunofluorescence for CD3+ T cells (green) and CD45R+ B cells (83) of the indicated mice. Scale bars: 100 μm. Quantification of the follicle areas from indicated mice. Data are expressed as mean ± SEM and were analyzed with a Mann-Whitney test; ***P < 0.001.

