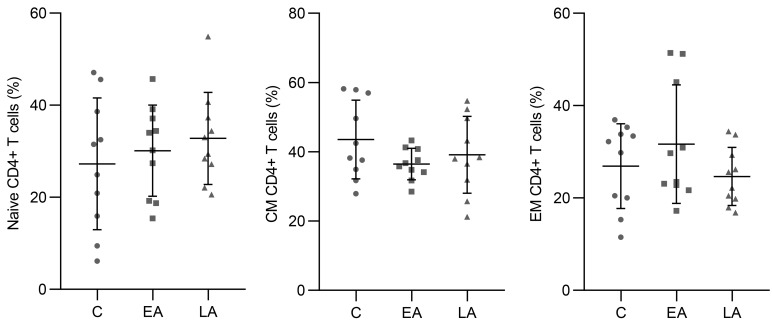
Figure 1. Frequencies of CD4+ T cell subpopulations in HCs and EA and LA HIV-1–infected patients.
The frequencies (mean and SD) of naive, CM, and EM CD4+ T cells from HCs (n = 10), EA (n = 10), and LA (n = 10) are shown. ANOVA was used to assess differences between groups. This experiment was conducted 1 time. C: control. Symbols represent individuals; horizontal bars indicate the mean ± SD.

