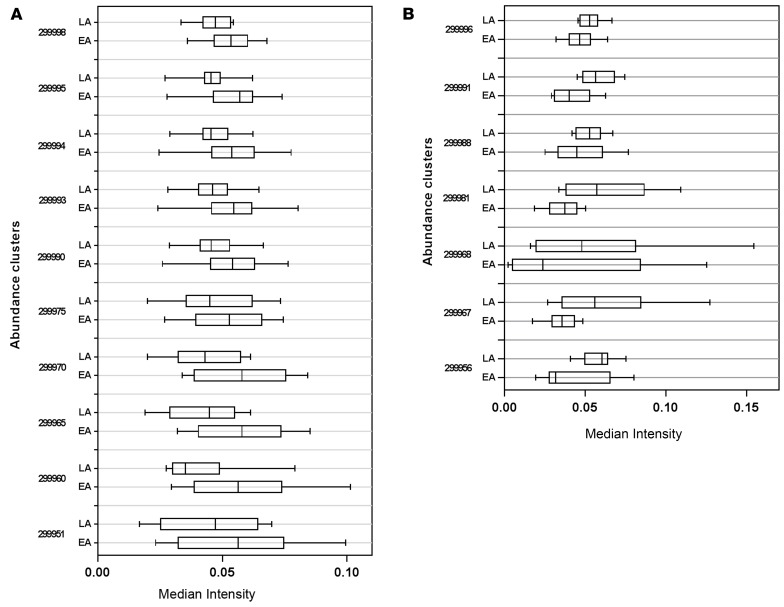
Figure 5. Citrus clusters showing a significantly different abundance in EA than LA HIV-1–infected patients.
(A) CD4+ T cell clusters with higher abundance in EA (n = 10) compared with LA (n = 10) patients. (B) CD4+ T cell clusters with higher abundance in LA compared with EA patients. The box-and-whisker plots depict the minimum and maximum values (whiskers), the upper and lower quartiles, and the median. The length of the box represents the interquartile range.

