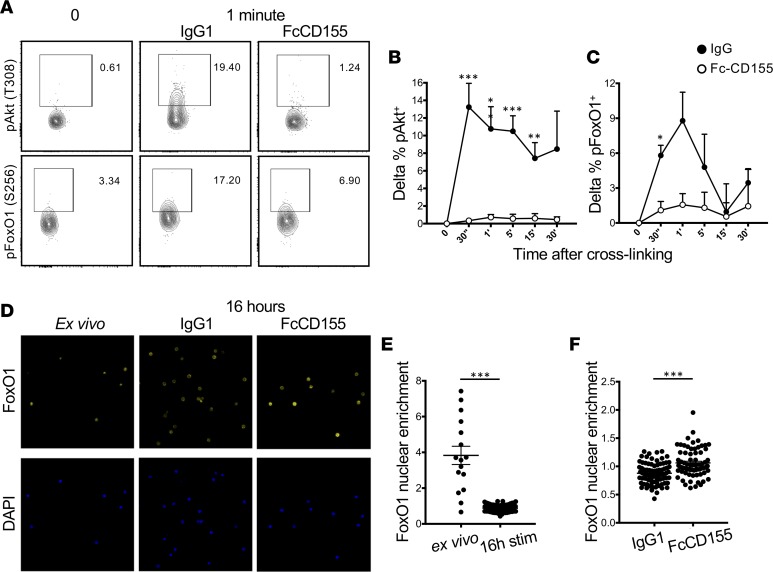
Figure 3. TIGIT stimulation suppresses the Akt/FoxO1 pathway.
(A–C) Tregs stimulated for the indicated times with αCD3+αCD28, IL-12, Fc-CD155, or isotype control. One representative experiment (A) and quantification of the delta between the indicated time points and the time 0 condition are shown (B, n = 7 for pAkt, and C, n = 5 for pFoxO1, paired t test with Bonferroni’s correction for multiple comparisons). (D–F) Sorted Tregs were rested in serum-free media for 2 hours and then fixed (ex vivo) or stimulated with αCD3+αCD28, IL-12, FcCD155, or isotype control overnight (16 hours). One representative experiment showing immunofluorescent staining for DAPI and FoxO1 (original magnification, ×63) (D) and quantification of the nuclear enrichment of FoxO1 for 2 donors (E and F, 2 outliers were removed [ROUT Q = 10%], unpaired t test, P < 0.0001; ex vivo = 16 cells, 16hstim = 80 cells, IgG1 = 80 cells, FcCD155 = 71 cells). *P < 0.05, **P < 0.005, ***P < 0.0005.

