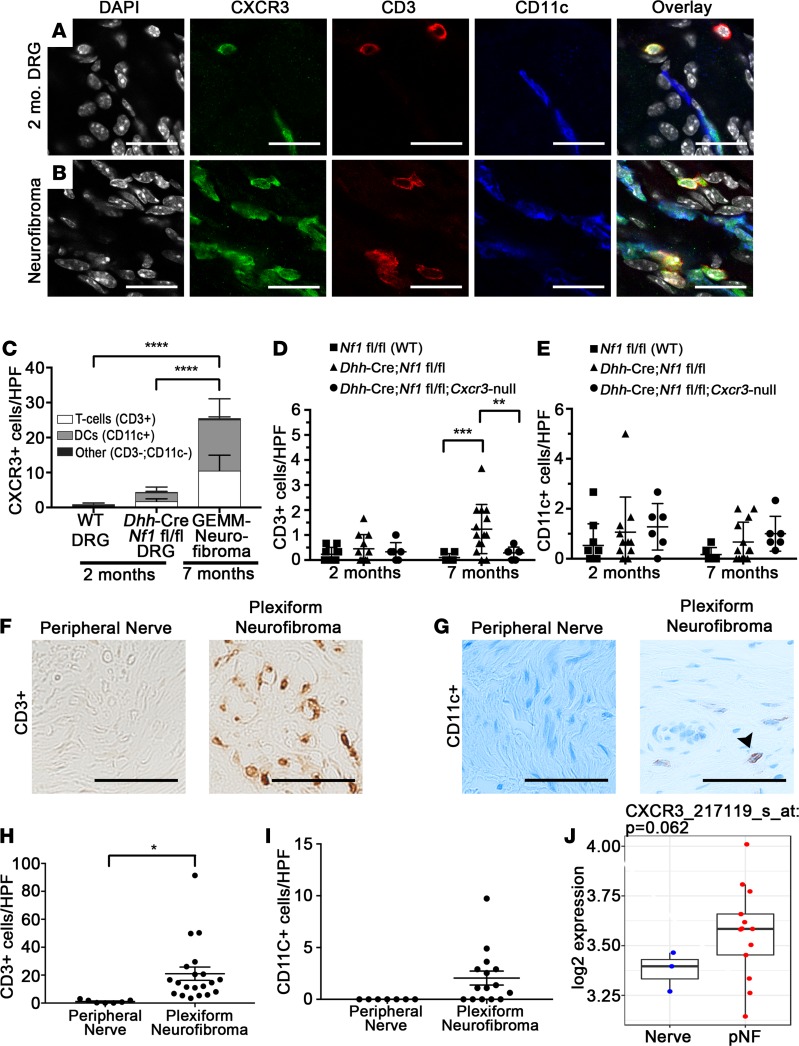
Figure 5. Identification of Cxcr3-expressing cells in Dhh-Cre Nf1fl/fl nerve/DRG and neurofibroma.
(A) Cxcr3 expression colocalizes with CD3+ T cells and CD11c+ DCs in 2-month nerve/DRG (original magnification, ×60. Scale bar: 20 μm) and (B) in 7-month neurofibroma (original magnification, ×60. Scale bar: 20 μm). (C) Cxcr3-expressing cells are rare in WT nerves (n = 4) and are predominantly T cells and DCs in Dhh-Cre Nf1fl/fl nerve/DRG (n = 9) and neurofibroma (n = 7) (****P < 0.0001, 2-way ANOVA with Tukey’s MCT). The box plot depicts the minimum and maximum values (whiskers), the upper and lower quartiles, and the median. The length of the box represents the interquartile range. (D) T cells were rare in 2-month (n ≥ 4 all groups) sciatic nerves, but loss of Cxcr3 reduced T cell accumulation in 7-month Dhh-Cre Nf1fl/fl sciatic nerves (**P < 0.01, ***P < 0.001, 2-way ANOVA with Tukey’s MCT). Symbols represent individual mice; horizontal bars indicate the mean ± SD. (E) DC numbers in sciatic nerves were unaffected by loss of Cxcr3 (NS, 2-way ANOVA). (F and G) Colorimetric (DAB) staining of CD3+ T cells and CD11c+ DCs in human peripheral nerve and plexiform neurofibroma (original magnification, ×40. Scale bar: 50 μm). (F) T cells are absent in normal human peripheral nerves (n = 7) but numerous in human plexiform neurofibroma (n = 19). (G) DCs are absent in human peripheral nerves (n = 7) but detectable in some human plexiform neurofibromas (n = 15). Arrowhead points to CD11c+ (brown) cell. (H) Quantification of T cells (*P < 0.01, unpaired t test) and (I) quantification of CD11c+ cells (NS, P = 0.056, unpaired t test) in human tissue sections. (J) Box-and-whisker plot showing relative CXCR3 mRNA expression in human plexiform neurofibroma (pNF) versus normal human nerve. The box plot depicts the minimum and maximum values (whiskers), the upper and lower quartiles, and the median. The length of the box represents the interquartile range.

