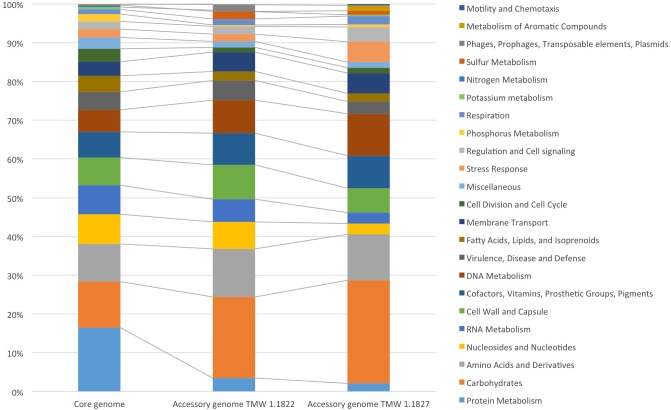
FIGURE 2.
Annotated SEED categories of proteins, divided in the core and accessory genomes of L. hordei TMW 1.1822 and L. nagelii TMW 1.1827, which was done by BADGE analysis. The proportion of proteins assigned to each SEED category with respect to the total number of proteins is shown in the bar chart.

