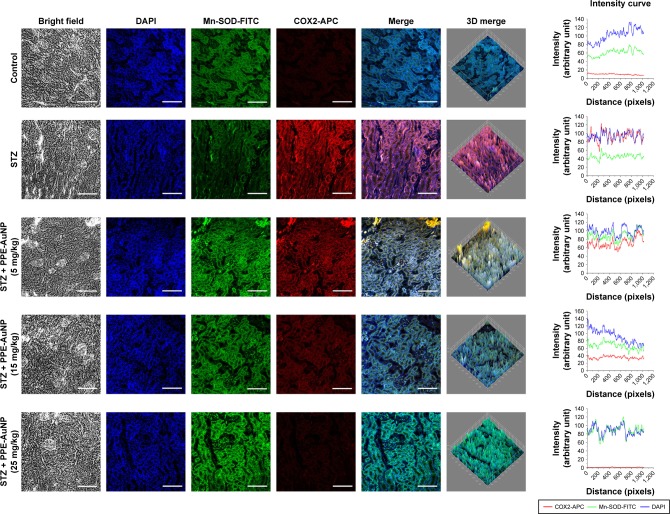
Figure 11.
Immunofluorescence images demonstrating the expression of Mn-SOD and COX2. Slides were viewed using a confocal microscope (magnification 20×). Respective fluorescence intensities (Mn-SOD-FITC, COX2-APC, and DAPI) were analyzed using ImageJ software through RGB calculator.
Abbreviations: APC, allophycocyanin; RGB, red-green-blue; SOD, superoxide dismutase.

