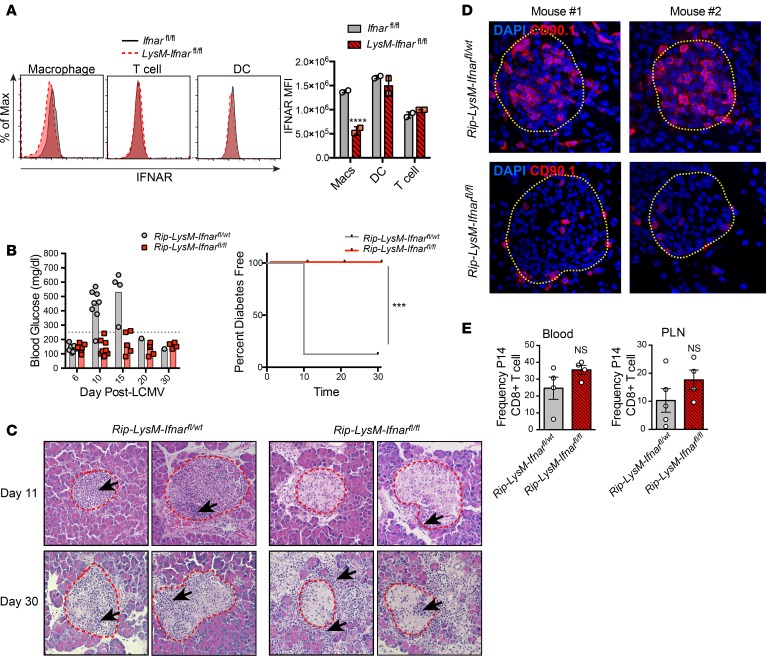
Figure 3. Genetic deletion of Ifnar from macrophages spares mice from T1D.
(A) IFNAR expression levels (based on mean fluorescence intensity; MFI) on defined cellular subsets in the spleens of Rip-LysM-Ifnarfl/fl mice compared with Ifnarfl/fl mice. The following markers were used to gate splenic cell subsets: macrophages (CD11b+CD11c–F4/80+), T cells (CD3+), and DCs (CD11b–CD11c+). Statistical significance was measured using 2-way ANOVA. (B) Rip-LysM-Ifnarfl/fl and Rip-LysM-Ifnarfl/wt mice were infected with LCMV-Cl13, and BG levels were monitored over at 30-day period. Clinical diabetes was confirmed in mice that displayed BG levels significantly over >250mg/dl. (C) H&E staining (20× magnification) of pancreata from mice at day 11 p.i. and day 30 p.i. Red outlines depict islet boundaries. (D) Immunofluorescence detection (40× magnification) of P14 CD8+ T cells expressing the congenic surface marker CD90.1 in the pancreata of Rip-LysM-Ifnarfl/fl and Rip-LysM-Ifnarfl/wt at day 10 p.i. Yellow outlines depict islet boundaries. (E) Frequencies of P14 CD8+ T cells in the blood and PLN at day 10 p.i. IFNAR expression levels in the spleen are derived from 2 mice per group. Representative immunofluorescence images of P14 CD8+ T cells are derived from 4 mice per group. Black arrows in C represent areas of significant lymphoid accumulation. Statistical significant of T1D disease incidence was measured using a log-rank (Mantel-Cox) test. Data presented as average ± SEM. ***P < 0.001, ****P < 0.0001.

