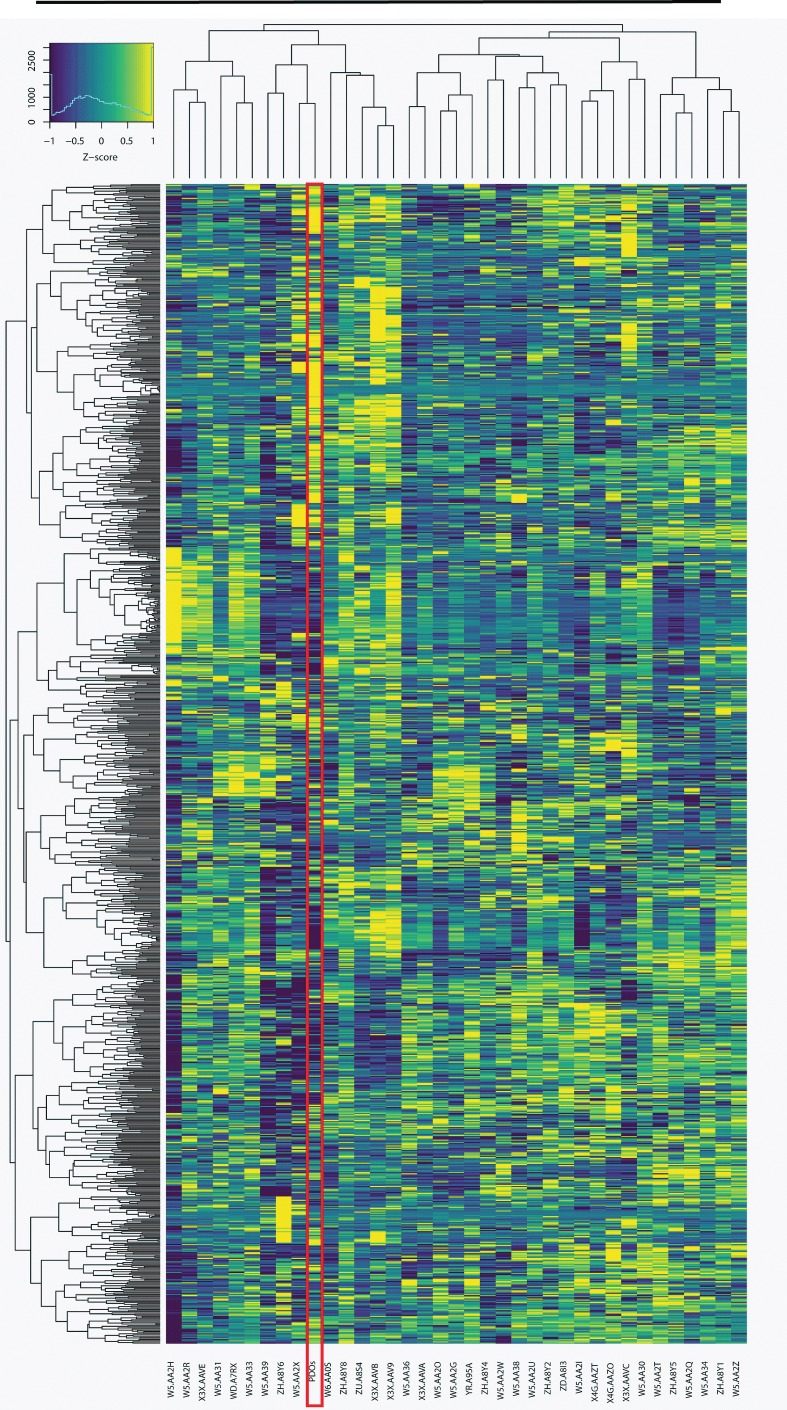
Figure 7. The gene expression from patient CCA8 clusters with a subset of patients from TCGA.
Heatmap of the gene expression (the log2 of the FPKM on the y axis with the color bar representing the deviation from the mean, Z score, as in Figure 5B) for the cholangiocarcinoma sample set from TCGA (n = 36) compared with the mean gene expression of the 6 PDOs from patient CCA8. The hierarchical clustering agglomeration (using Pearson’s correlation and the minimal variance method) was based on the 1,000 genes with the greatest variance after excluding 541 normal liver genes as was done in Farshidfar et al. (16). Four main sample clusters were observed. The gene expression for patient CCA8 clusters with 8 of the samples from the TCGA.

