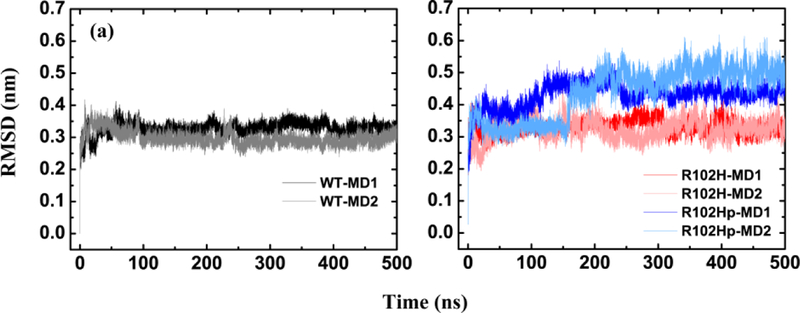
Figure 1.

Time evolution of the backbone RMSDs include the core structure (E11 to K174) for WT NCS-1 (black and gray curve), its R102H mutant NCS-1 (red and pink curve) and its R102Hprotonated mutant (blue and light blue curve) in two different MD trajectories (WT-MD1, WT-MD2 for the WT NCS-1, R102H-MD1, R102H-MD2 for the R102H mutant and R102Hp-MD1, R102Hp-MD2 for the R102Hprotonated mutant).
