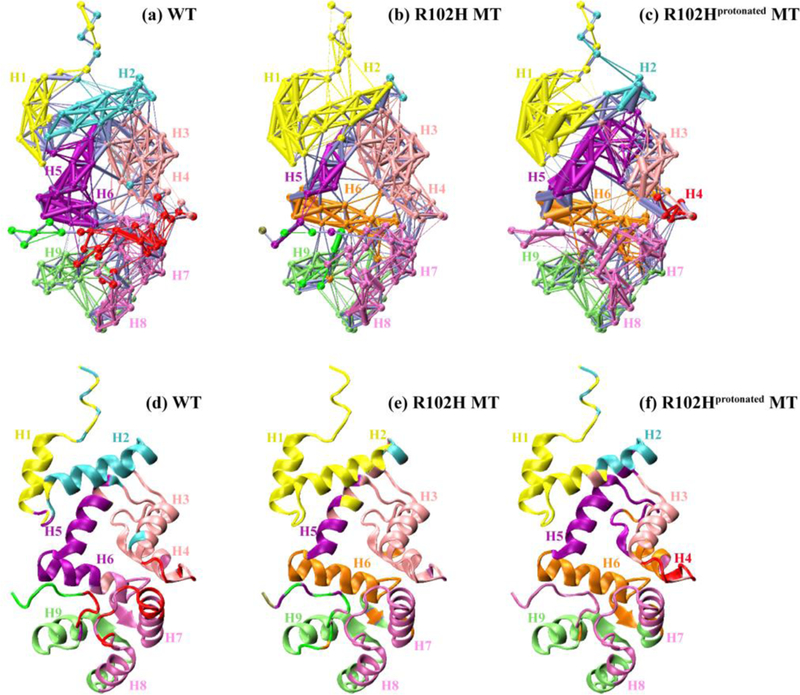
Figure 5.

Community networks formed in the WT NCS-1 (a), the R102H mutant (b) and the R102Hprotonated mutant (c) with edge widths corresponding to their weights based on MD simulations. Each community has its own color, superimposed on the initial MD simulation structure. The corresponding cartoon representations at t = 0 ns are shown in (d), (e) and (f).
