
Figure 2. Large‐scale in vitro experiments testing predicted SR interactions in head and neck cancer.
- Evaluation of predicted SR (DD) interactions in a large‐scale shRNA H&N HN12 cell line screen. The y‐axis displays the precision and recall of INCISOR‐predicted SRs in identifying the 45 experimentally determined DD‐SR rescuers of mTOR. The vertical dashed line denotes a threshold of FDR = 0.05 over the predicted INCISOR interaction scores. The stars indicate precision and recall at a threshold level where INCISOR identifies 75 genes as DD‐SR rescuers. The horizontal line (in gray) shows the precision expected by the random chance. The inset displays top 10 predicted genes whose knockdowns are rescued by mTOR inhibition. Significance was quantified using a one‐sided Wilcoxon rank‐sum test over three technical replicates with at least two independent shRNAs knockdowns per each gene. For 8 of these KDs, at least two shRNA individually show the rescue effect. The black horizontal line indicates the median effect of Rapamycin treatment in controls as a reference point. Box plot limits (Q1, Q3) and whiskers (±1.5 * inter quartile range from hinge) follow a standard definition.
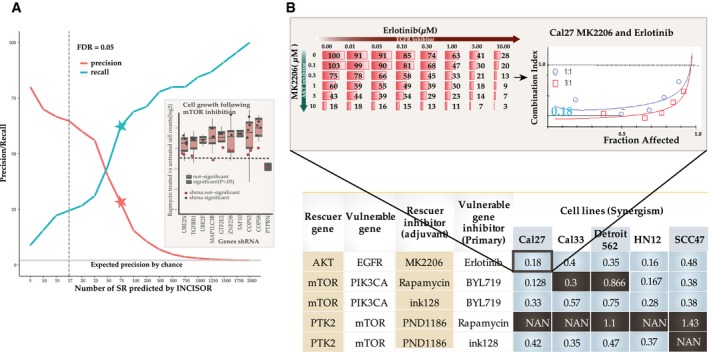
- Experimental validation of predicted synergistic SR‐based combinational therapies in head and neck cancer: A table summarizing the experimentally observed synergism between primary drugs and their predicted rescuer‐targeting treatments in 5 HNSC cell lines, based on drug treatment experiments. Synergism was estimated using standard Fa‐CI analysis. The table displays the average combination index (CI; synergism CI < 1, additivity effect CI = 1, antagonism CI > 1, NAN indeterminate CI) at 50% growth inhibition (fraction affected). Combinations that are synergistic are colored blue (black otherwise) for each cell lines tested. The inset shows an example of CI calculation for BYL719 and dasatinib combination in HN12 cell lines based on the corresponding dose matrix (number indicates % cell viability at 48 h, n = 3) and Fa‐CI curve.