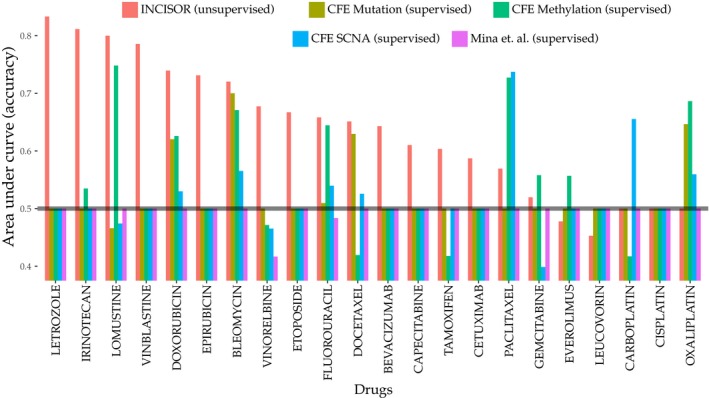
Figure 5. Comparative analysis of INCISOR.

A comparative study of INCISOR's performance (red bars) in predicting patients drug response (TCGA) compared to ISLE‐ and CFE‐based approaches (other colors). The area under the curve (y‐axis) displays the predictive performance of different methods for 22 FDA‐approved drugs in TCGA. Predictions of CFE (cancer functional events) identified by Iorio et al (2016) are displayed separately for CFEs inferred from mutation, methylation, and SCNA data.
