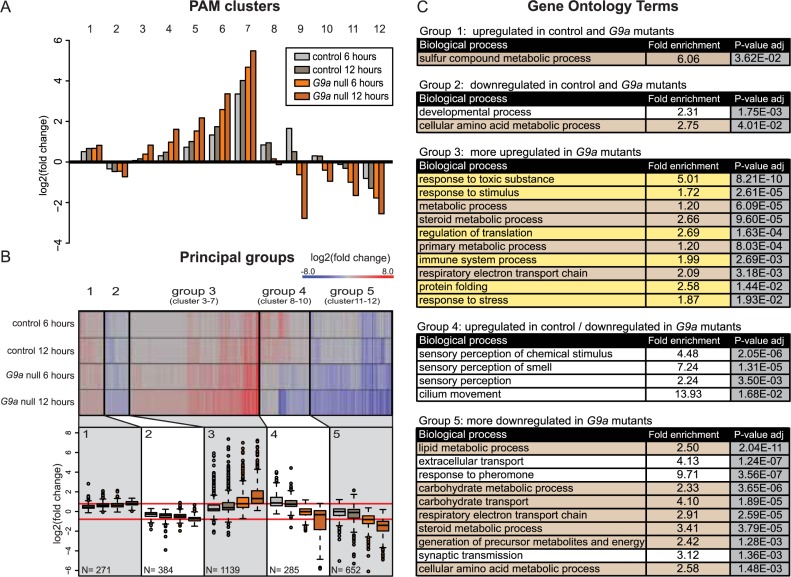
Fig 2. G9a mutants show highly augmented transcriptional response of genes regulating stress defenses and metabolism.
(A) PAM clustering of differentially expressed genes base on log2 fold change values obtained from differential expression analysis in four pairwise comparisons. (B) Heatmap and boxplots of log2 fold changes of differentially expressed genes combined into five principle groups derived from clusters with similar patterns of differential expression. The five principle groups show up-regulation in G9a mutants and controls (group 1, cluster 1), down-regulation in G9a mutants and controls (group 2, cluster 2), more up-regulation in G9a mutants compared to controls (group 3, clusters 3–7), up-regulated in controls and down-regulated in G9a mutants (group 4, clusters 8–10), and more down-regulation in G9a mutants than in controls (group 5, clusters 11 and 12). The number of genes in each group is indicated. (C) Gene ontology analysis showing the top enriched biological processes sorted by adjusted (Bonferroni-corrected) p-value in each of the five principal groups, indicating enrichment in stress response genes (highlighted in yellow) and metabolic genes (highlighted in brown). The numerical data depicted in this figure can be found in S5 Data. PAM, partitioning around medoids.

