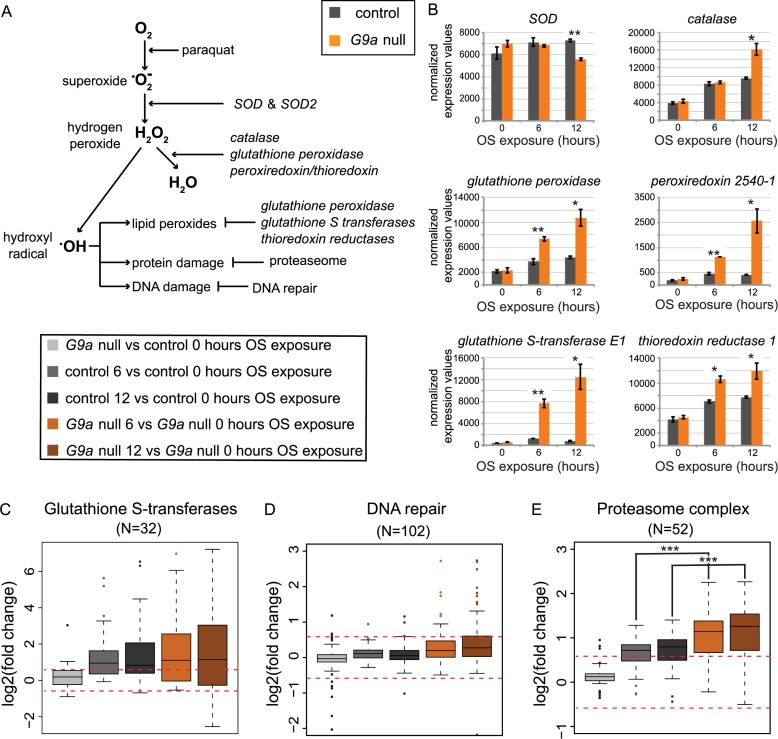
Fig 3. Enhanced expression of antioxidant and ROS damage pathway genes in G9a mutants upon OS exposure.
(A) Schematic diagram of enzymes crucial for ROS elimination and prevention of ROS-mediated damage. (B) Normalized expression values for selected genes involved in ROS elimination and ROS-mediated damage in G9a mutants and controls at 0, 6, and 12 h after OS induction. Significance was determined using Student t test. (C–E) Boxplots showing log2 fold changes for selected groups of genes encoding glutathione S-transferases, peroxisomal proteins, and the DNA repair machinery. Fold changes were derived from the following pairwise comparisons: G9a mutant versus control after 0 h OS (light gray), control 0 versus 6 (dark gray) and 12 h (black) of OS, and G9a mutant 0 versus 6 (orange) and 12 h (brown) of OS. Statistical comparisons between groups were performed using a Wilcoxon signed-rank test. ***p < 0.001; **p < 0.01; *p < 0.05. The numerical data depicted in this figure can be found in S5 Data. H2O2, hydrogen peroxide; OS, oxidative stress; ROS, reactive oxygen species; SOD, superoxide dismutase.

