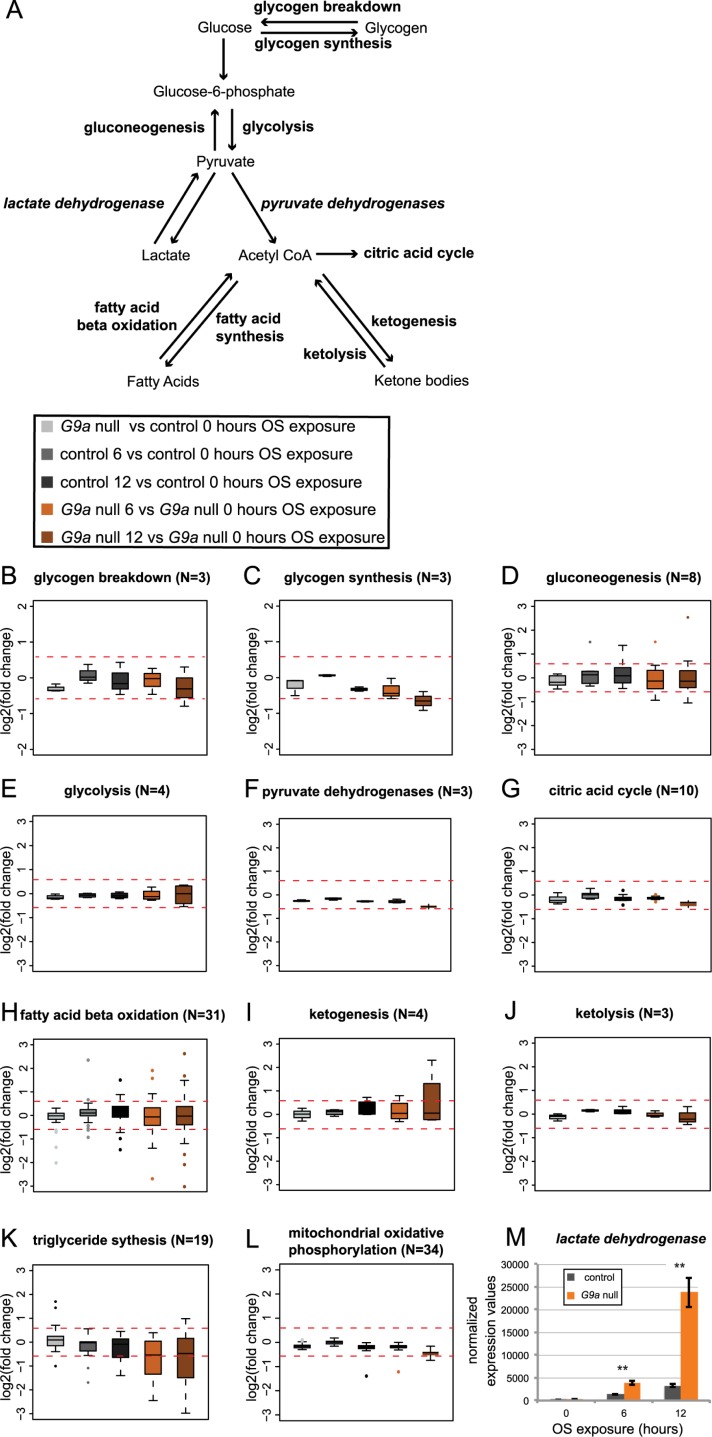
Fig 5. Altered expression of metabolic enzymes regulating energy storage and release in G9a mutants upon OS exposure.
(A) Simplified schematic diagram of energy metabolism. (B-L) Boxplots showing log2 fold changes for selected groups of genes encoding enzymes involved in glycogen breakdown (B), glycogen synthesis (C), gluconeogenesis (D), glycolysis (E), pyruvate dehydrogenases (F), citric acid cycle (G), fatty acid beta oxidation (H), ketogenesis (I), ketolysis (J), triglyceride synthesis (K), and mitochondrial oxidative phosphorylation (L). Fold changes were derived from the following pairwise comparisons: G9a mutant versus control after 0 h OS (light gray), control 0 h versus 6 h (dark gray) and 12 h (black) of OS, and G9a mutant 0 h versus 6 h (orange) and 12 h (brown) of OS. (M) Normalized expression values for lactate dehydrogenase. p-Values were obtained using a Student t test. **p < 0.01. The numerical data depicted in this figure can be found in S5 Data. OS, oxidative stress.

