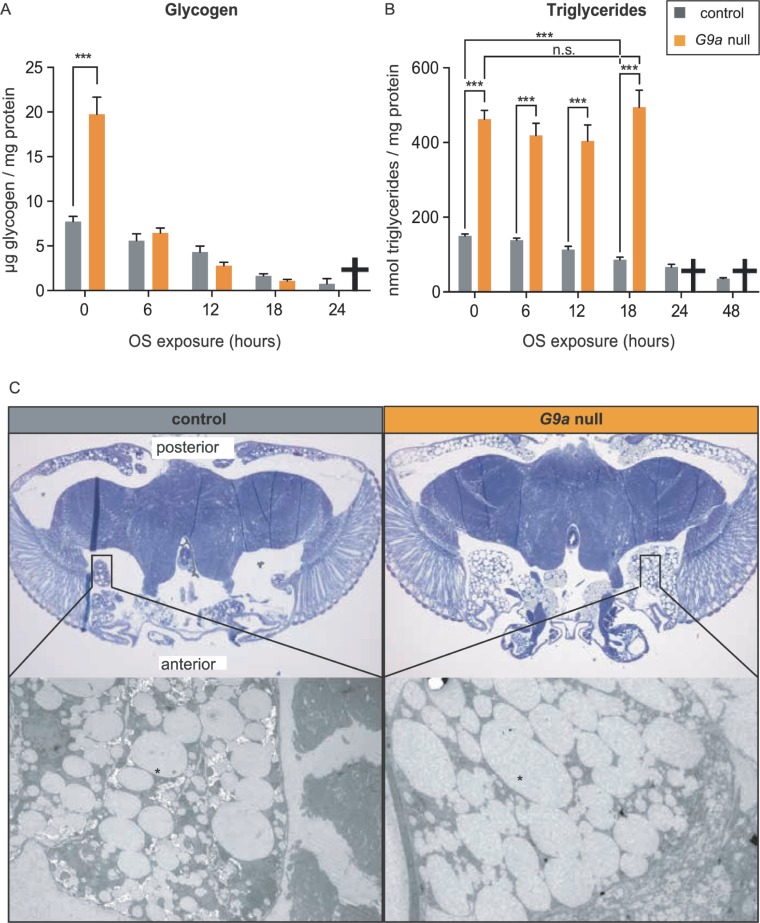
Fig 6. Altered energy stores and accelerated energy consumption in G9a mutants during OS exposure.
(A) Glycogen and (B) triglyceride levels in G9a mutants and controls over a time course of OS exposure. Bar graphs showing mean values and SEMs were generated using Graphpad, and p-values were obtained using multiple t tests with FDR correction. ***p < 0.001; n.s., p > 0.05. Metabolites could not be measured for the G9a mutants at 24 and 48 h time points, as the vast majority of flies had died (indicated by a cross). (C) Images from toluidine blue–stained sections of G9a mutant and controls heads obtained using bright-field 10× magnification (top) and scanning electron (bottom) microscopy. Fat body tissues (black rectangle) lateral anterior and posterior are enlarged in G9a mutants. Electron microscopy sections show lipid droplets (indicated by star), which are larger in G9a mutants than in controls. The numerical data depicted in this figure can be found in S5 Data. FDR, false discovery rate; n.s., not significant; OS, oxidative stress.

