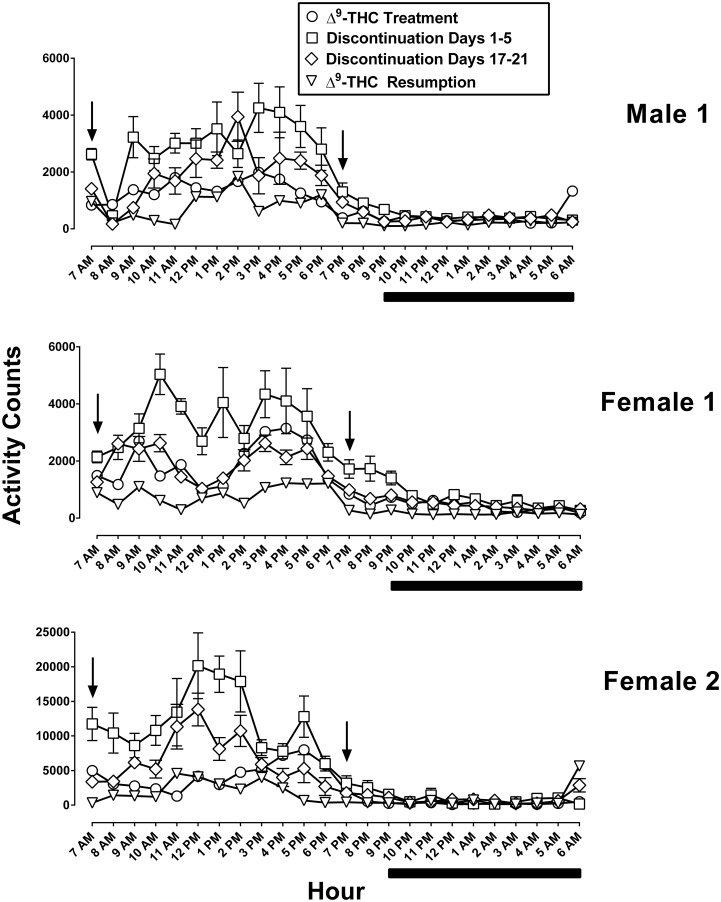
Fig 1. Absolute activity counts cumulated in 1-h bins and expressed for each h of the 24-h light/dark period.
Each panel represents data from an individual monkey. Symbols are an average of 5 consecutive days including the 5 days immediately preceding discontinuation of Δ9-THC treatment (circles), the first and last 5 days of discontinued treatment (squares and diamonds, respectively), as well as the first 5 days of resumption of Δ9-THC treatment (triangles). The arrows indicate the time of Δ9-THC (1 mg/kg) or vehicle administration; vehicle was administered instead of Δ9-THC during the discontinuation phase. Below the abscissae the solid line denotes the dark period. Note the larger range of values on the ordinate of the lower panel as compared with the middle and top panels.

