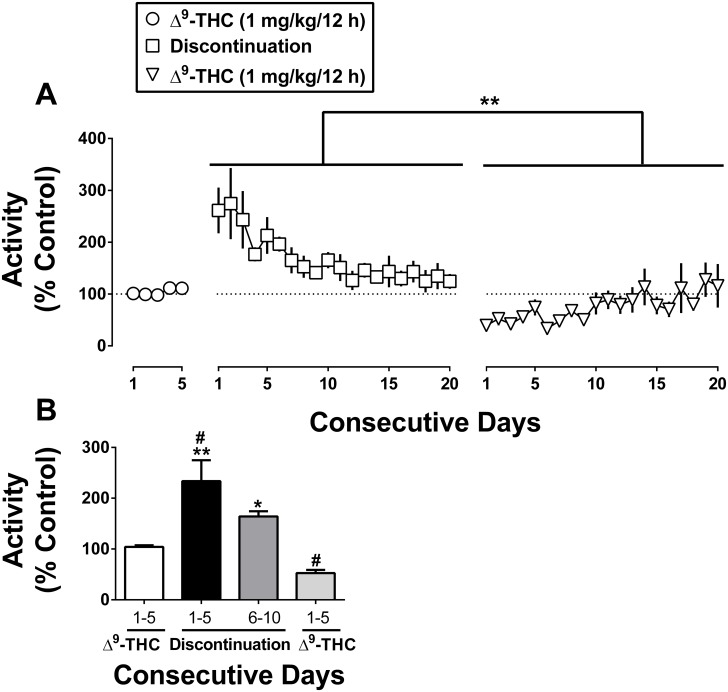
Fig 2. Activity counts from Fig 1 cumulated daily (i.e., for 24 h) and expressed as a percentage of control.
Consecutive days at various stages including before, during, and after discontinuation of Δ9-THC treatment (top panel). The mean activity counts for the 5 consecutive days immediately preceding discontinuation of Δ9-THC treatment, day 1–5 and day 6–10 Δ9-THC discontinuation, and day 1–5 resumption of Δ9-THC are also shown (bottom panel). # P < 0.05 vs. the days preceding discontinuation of Δ9-THC. *P < 0.05 and **P < 0.01 vs. resumption of Δ9-THC. Data reflect mean ± SEM, n = 3 monkeys.

