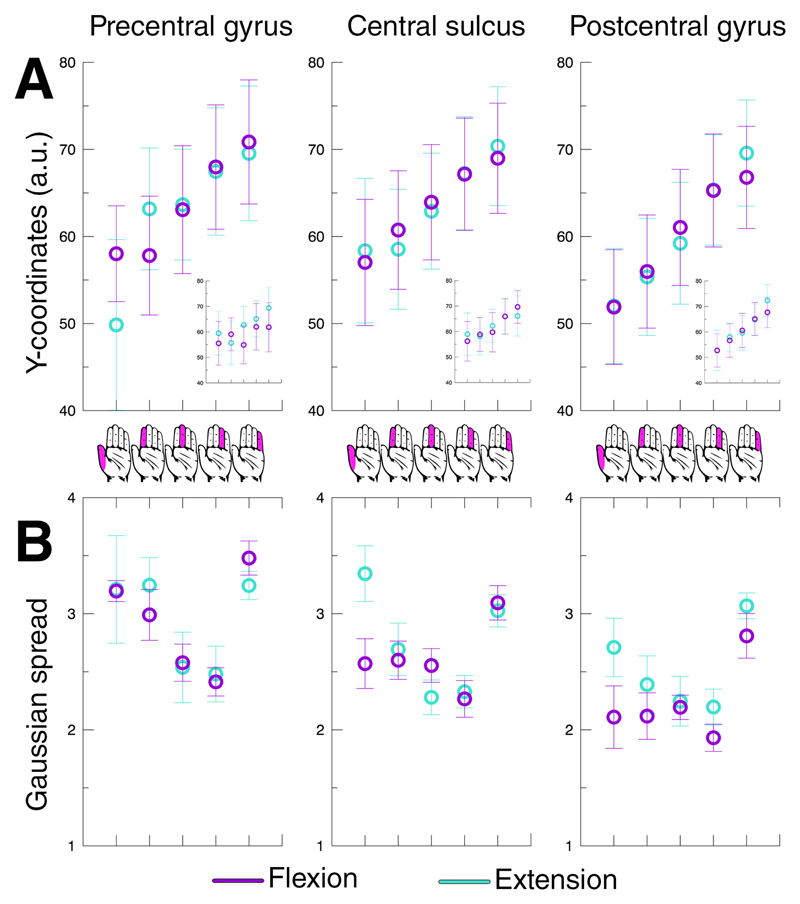
Figure 4. Average finger digit location and pRF size.
The top row depicts the average Y-coordinate on a flattened reconstructed cortical surface for finger digit flexion (purple) and extension (cyan) across the 3 included cortical areas (A). Additionally, the results of a standard GLM analysis are presented per cortical region by the smaller graph-within-graphs. The bottom row shows the Gaussian spread averaged over subjects per finger digit representation (B). The error bars depict the standard error of the mean across subjects. The hand icons in the middle of the figure represent the legend of the horizontal axis for all graphs, referring to the corresponding finger digits per depicted data point.

