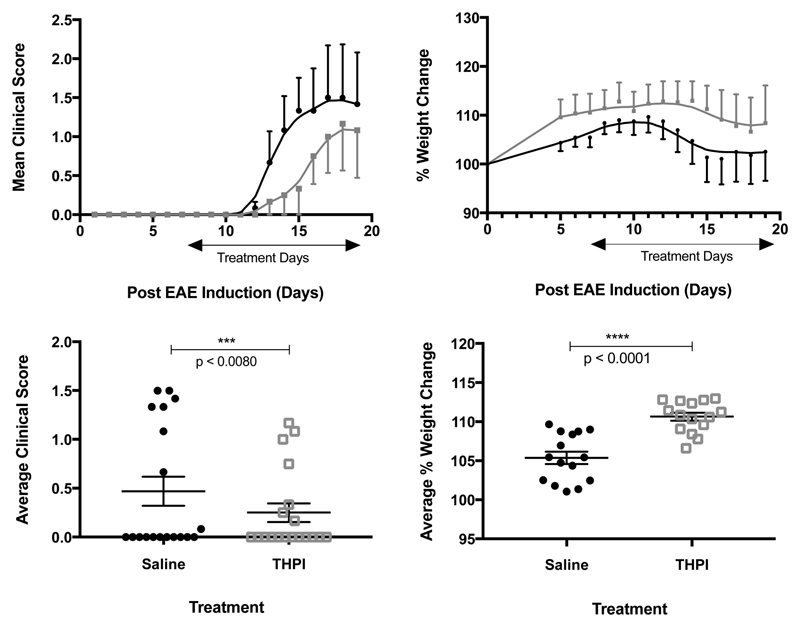
Figure 3.
Results of 12.43 μg of α1(V)GlyΨ{PO2H-CH2}Val [mep14,32,Flp15,33] THPI/day treatment of EAE mice. (A, top left) Clinical score of treated (gray) and nontreated (black) animals. (B, top right) Percent weight change of treated (black) and nontreated (gray) animals. (C, bottom left) Average clinical score of treated and nontreated animals over the course of the experiment. (D, bottom right) Average percent weight change of treated and nontreated animals from induction to sacrifice. n = 5 per group, *p < 0.05, **p < 0.01, ***p < 0.001, ****p < 0.0001. Statistical analysis was performed using a two-tailed Student t test.

