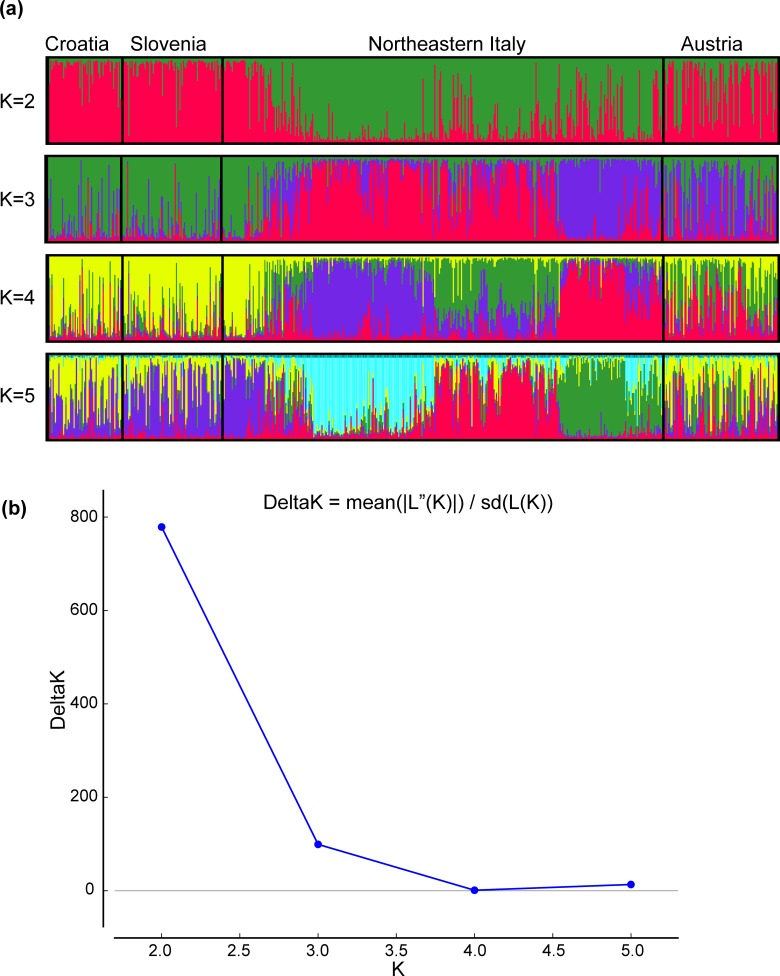
Fig 1. Structure results for the whole dataset.
(a) Structure graphs generated by Distruct 1.1 [89]. Cluster membership according to the analyses of 21 markers in the dataset (627 individuals), for K = 2–5. The individuals are presented along the x-axes. The thin vertical line represents the posterior probability (Q from 0 to 1) for each individual to belong to a different cluster. Different colors represent the membership to a specific inferred cluster. Groups A and B are colored in red and green, respectively (K2). A line with no clear assignment to either cluster (e.g. a line with no dominant colour) is considered as an admixed (or migrant) individual. (b) Structure analysis estimated K = 2 as the most likely number of clusters.

