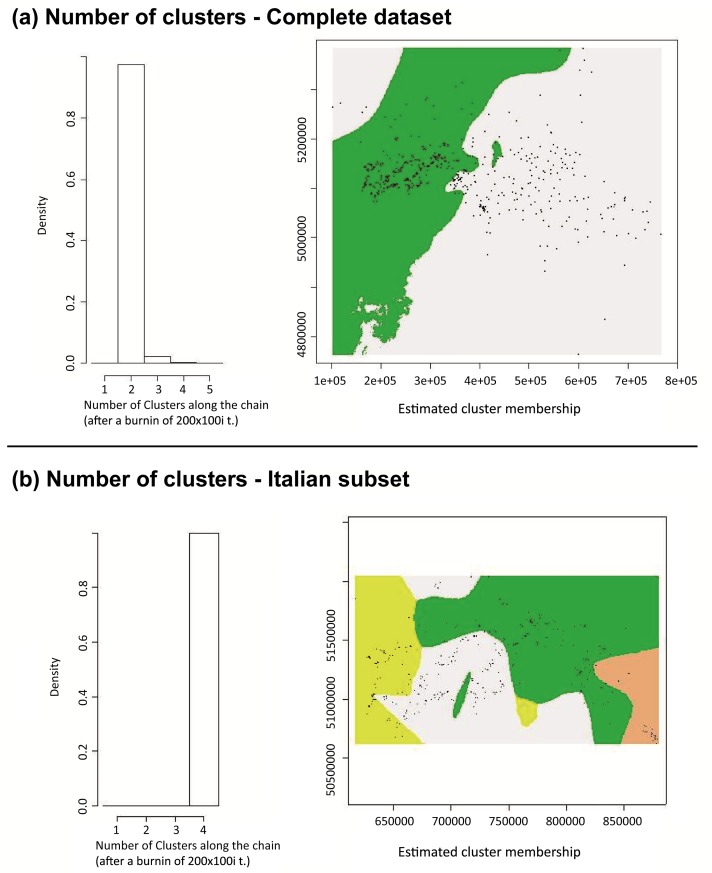
Fig 3. Spatial model results (Geneland).
a) Geneland results on the complete dataset. b) Geneland results on the Italian subset. Starting from the left, the first graphs show the maximum estimate of K (clusters) simulated from the posterior distribution. The maps on the right show the spatial characterization of the identified (K) clusters (mode of the posterior probability of belonging to each cluster). Samples are shown as black dots.

