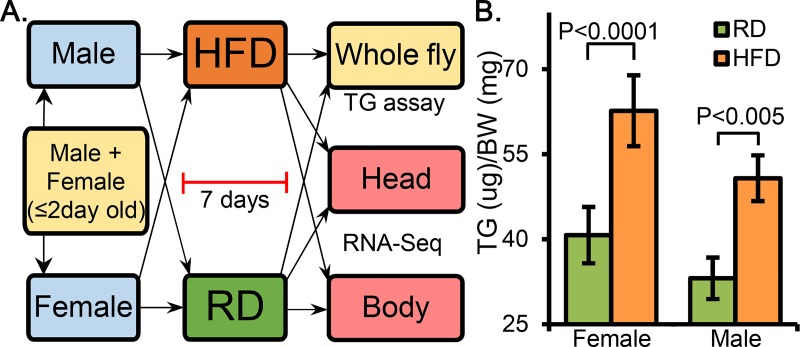
Fig 1. The protocol of HFD treatment and subsequent triglyceride (TG) levels.
Schematic of high-fat diet (HFD) and regular diet (RD) treatment of the flies (A) and the TG levels measured after 1-week of treatment (B). Age matched flies were given the respective diets for 1 week. The TG levels were measured in triplicates in each group.

