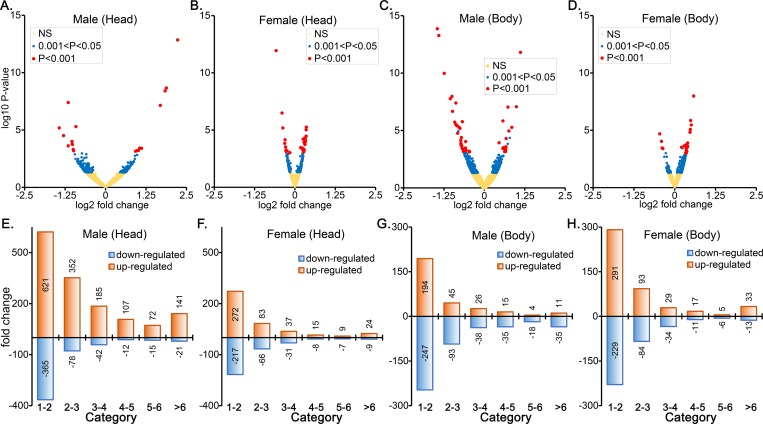
Fig 2. A robust transcription response to HFD in both heads and bodies of males than the females.
The volcano plots depict log10 P values versus log2 fold change for genes in head (A and B) and body (C and D) of males (A and C) and female (B and D). The wider shape of volcano plot in the heads (A) and in bodies (C) of males indicates the males being more responsive to HFD (having wider distribution of fold change). P<0.001, red circle; 0.05<P<0.001, blue circle. The number of differentially expressed genes in different fold-change categories in the heads (E and F) and bodies (G and H) in the males (E and G) and female (F and H). Higher number of genes are upregulated than downregulated.

