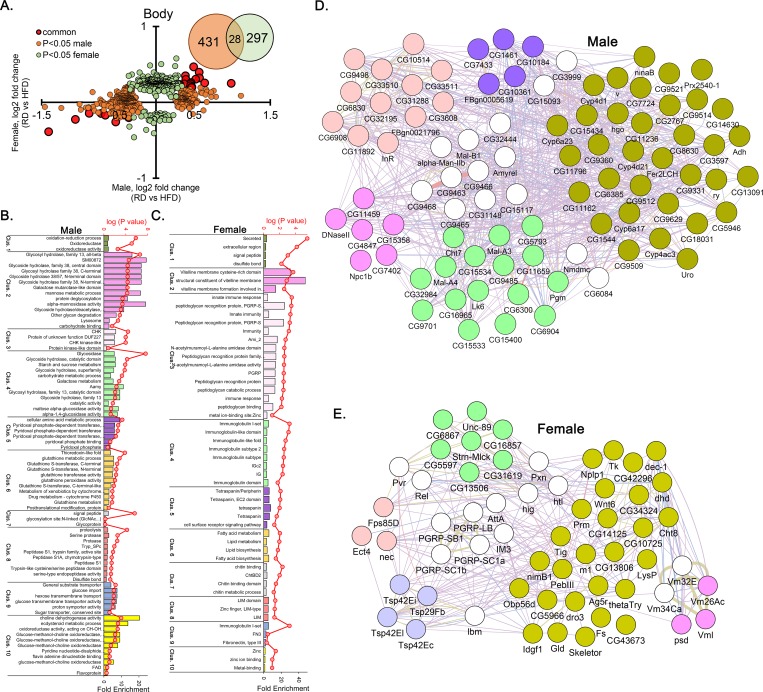
Fig 4. Transcriptional change in the bodies leading to HFD-induced sex specific pathway enrichment.
(A) Relative fold change between males and females bodies after HFD treatment. Insert; Venn diagram depicts the number of differentially expressed genes shared. (B) The top 10 Functional Annotation Clusters at medium stringency in males (B) and females (C) body genes. Network analysis depicting the differentially expressed genes interacting within the clusters as well as between the clusters for males (D) and females (E) body genes.

