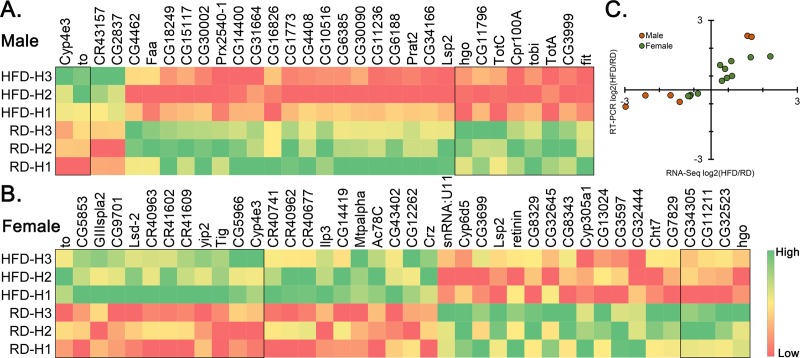
Fig 5. Heat map of differentially expressed genes in the heads.
Heat map depicting differentially expressed genes in the heads of male (A) and female (B) based on RNA-seq results. The genes with P<0.001 are in box. (C) Correlation between RNA-Seq (X-axis) and RT-PCR (Y-axis) results from the HFD/RD expression change (S3 Table). Green color, upregulation; red, downregulation.

