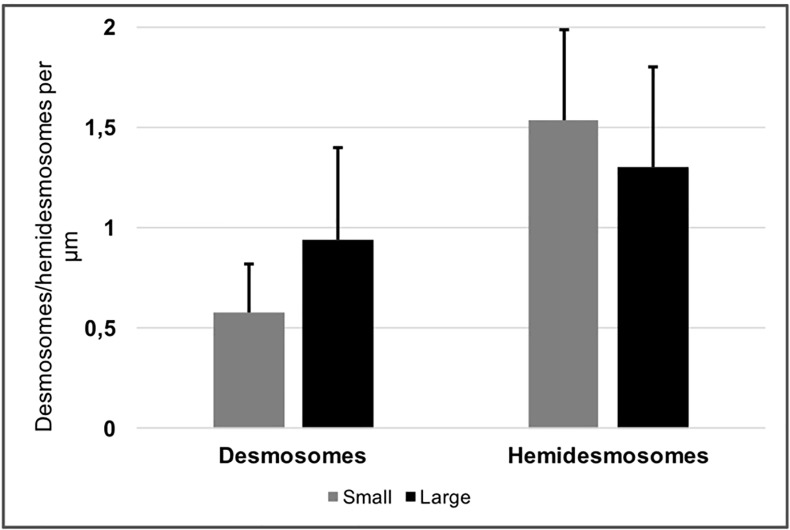
Fig 6. Quantification of desmosome and hemidesmosome density.
Bar chart showing the number of desmosomes (black) and hemidesmosomes (grey) per μm in human LEC derived from small and large explants. There were no significant differences between the groups. Error bars represent the standard deviation of mean values.

