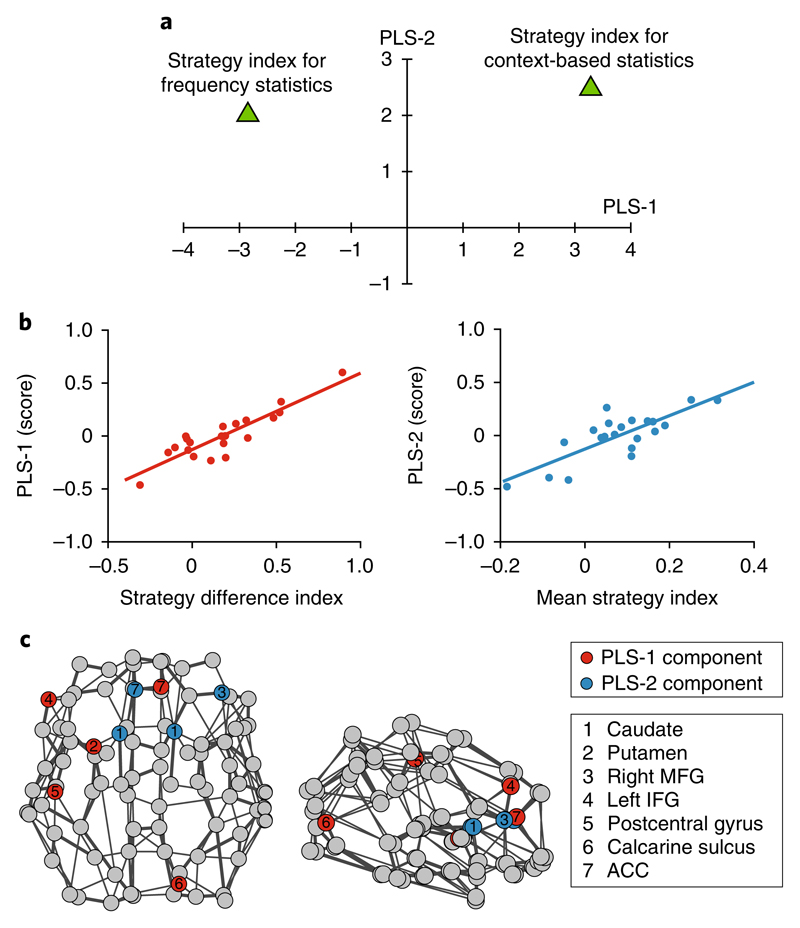
Fig. 7. PLS components predicting decision strategy.
a, Scatter plot of PLS-1 and PLS-2 weights (values akin to the z-score) for the response variables (that is, the strategy index for frequency versus context-based statistics). Supplementary Table 4b shows the numerical values of the PLS weights for each response variable. PLS-1 separates decision strategies for frequency versus context-based statistics (that is, negative versus positive weight), capturing changes in decision strategy across sequence levels. PLS-2 weights equally the strategy for frequency and context-based statistics, capturing variability in decision strategy across participants independent of the sequence levels. b, Pearson correlations (two-sided; n = 21) of PLS-1 score with difference in strategy index for frequency and context-based statistics (r(19) = 0.89; P < 0.001; CI = 0.68 to 0.96) (left) and PLS-2 score with mean strategy index (r(19) = 0.79; P < 0.001; CI = 0.49 to 0.92) (right). c, Significant predictors (|z| > 2.576; P = 0.01) for the first two PLS components are shown on axial (left) and sagittal (right) views of the DTI graph for illustration purposes only (neurological convention: left is left). Red nodes indicate the significant predictors for PLS-1 and blue nodes the significant predictors for PLS-2, irrespective of imaging modality (rs-fMRI or DTI) or graph metric (degree change or clustering coefficient change).

