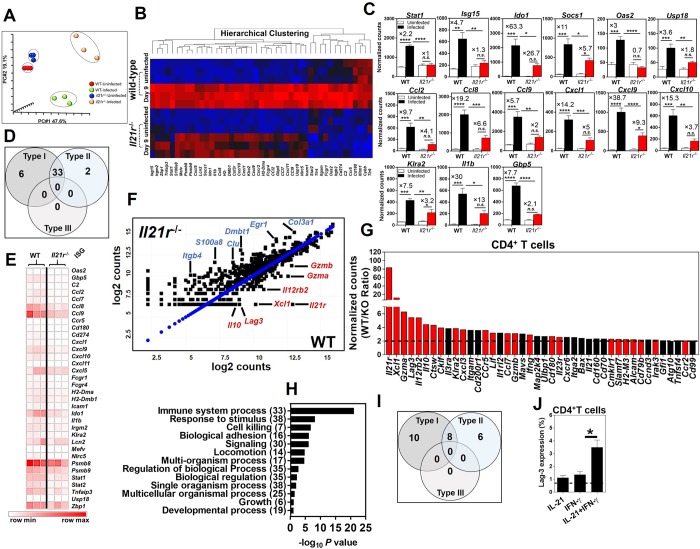
Fig 3. IL-21/IL-21R signaling axis is critical for the optimal expression of ISGs following colon infection.
A. Principal component analysis (PCA) of Nanostring gene expression datasets from whole distal colons of uninfected and infected WT and Il21r-/- mice at 9 days p.i. (n = 3/genotype/time-point). B. Heatmap of differential gene expression profiles in the whole distal colon of uninfected and infected WT and Il21r-/- mice at 9 days p.i. (red, upregulated; blue, downregulated). C. Normalized expression levels of ISGs in the whole distal colon of uninfected versus infected WT and Il21r-/- mice at 9 days p.i. (n = 3/genotype/time-point). The gene expression of each gene was normalized to the geometric mean of the expression of internal reference genes and presented as normalized counts/gene/biological sample (see Nanostring Methods). Genes with fold difference ≥ 2 between WT/Il21r-/- mice were considered. Data represent the mean ± SEM of normalized counts. *p < 0.05; **p < 0.01; ***p < 0.001; ****p < 0.0001; One-way ANOVA followed by Bonferroni post-hoc adjustment test for multiple comparison. D. Venn diagram representing the number of type I-, type II- and type I/II-specific ISGs, as analyzed using the Interferome Database with impaired upregulation during infection in the whole distal colon of Il21r-/- mice 9 days p.i. versus WT controls. E. Heatmap of differential expression of ISGs in the whole distal colon of Il21r-/- mice as compared with WT controls at 9 days p.i. F. Scatter plot representation (log2 values) of gene expression levels in FACS-sorted mucosal CD4+ T cells isolated from the distal colon of WT and Il21r-/- mice at 9 days p.i. G. Histogram shows fold impairment of genes in rank order in Il21r-/- mice versus WT controls (Bars in red represent known ISGs, and appear to be the dominant class of gene impaired). Black bars represent impaired genes in CD4+ T cells from Il21r-/- mice that are not known ISGs. Genes with fold difference ≥ 2 between WT/Il21r-/- mice were considered. H. Gene ontology analysis of processes enriched in mucosal CD4+ T cells from the distal colons of WT controls versus Il21r-/- mice (WT/Il21r-/- ratio) 9 days p.i. Genes with fold difference ≥ 2 were considered. I. Venn diagram representing the number of type I-, type II-, type III- and type I/II-specific ISGs impaired in FACS-sorted CD4+ T cells isolated from the distal colon of Il21r-/- mice 9 days p.i., as analyzed using the Interferome Database. J. The induction of a representative ISG, LAG-3, in CD4+ T cells isolated from naïve Il21r-/- mice and WT controls. Cells were cultured in the presence of mIFN-γ (20 ng/ml) or mIL-21 (20 ng/ml) alone or in combination for 24 hr and the surface expression of LAG-3 was determined by flow cytometry. Data are the Mean ± SEM from two pooled independent experiments with a total of 6 (Il21r-/-) or 6 (WT) mice/group. *p < 0.05 determined by Mann-Whitney U test.

