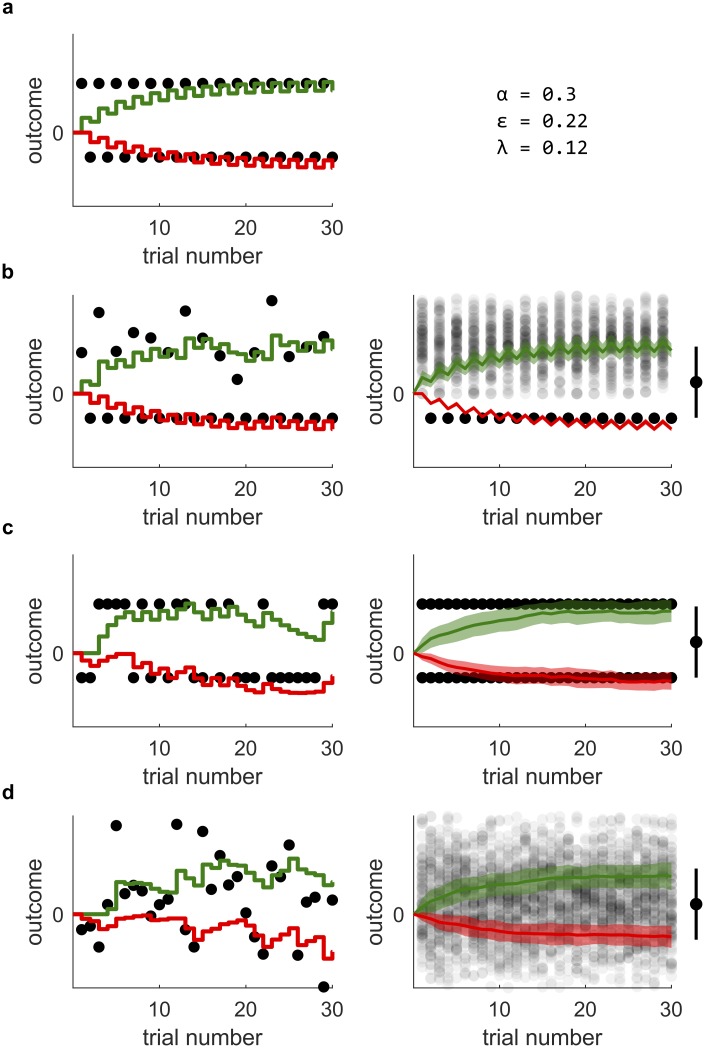
Fig 5. Simulations of learning.
In all graphs, the collective strength G of the Go weights is depicted in green, while the negative collective strength −N of the No-Go weights is depicted in red. The received reinforcements are indicated by solid black dots in the panels on the left, and by transparent black dots in the panels on the right. Each simulation shows how G and N change due to the reception of 30 prediction errors. Panel (a) contains a simulation based on predictable, alternating reinforcements. It also contains the parameter values used for the simulations. Panels (b) to (d) show both single and averaged simulations of stochastic reinforcements: On the left, we show a single sequence of learning, with reinforcements sampled from different distributions. On the right, we show averages over many such sequences of learning. There, the mean weights are depicted as green and red lines, while the shaded green and red areas around these lines of G and N in the right column indicate one standard deviation. The bars to the right of the averaged learning curves indicate the mean and mean spreads of the respective reinforcement distributions.

