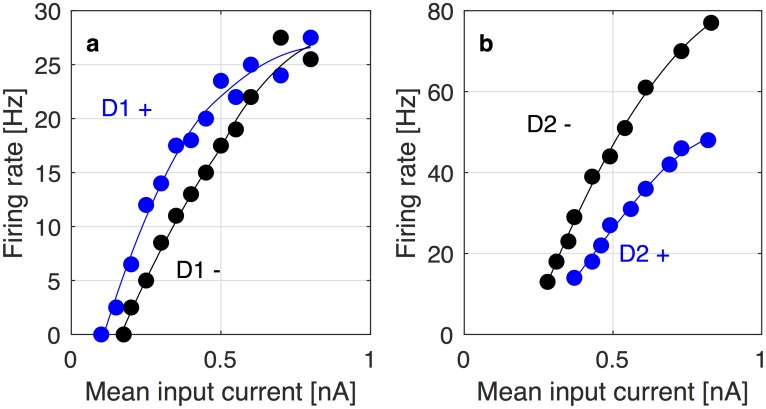
Fig 7. fI-curves of D1- and D2-expressing neurons at different levels of receptor activation.
(a) fI-curves of a D1-expressing pyramidal neuron, replotted from [23]. The blue points are recorded from a neuron at a higher level of D1 receptor activation (e.g. with dopamine present), the black points are recorded at a lower level of receptor activation (e.g. without dopamine). Smooth curves have been obtained from the data through LOESS regression to serve as visual guides (black and blue lines). (b) fI-curves of a D2-expressing neuron, replotted from [24]. The blue points are recorded from a neuron at a higher level of D2 receptor activation (e.g. in the presence of the D2 agonist quinpirole), the black points are recorded from a neuron in the control group at a lower level of D2 activation (e.g. in the absence of the agonist). As in panel (a), LOESS curves (black and blue lines) have been added as visual guides.

