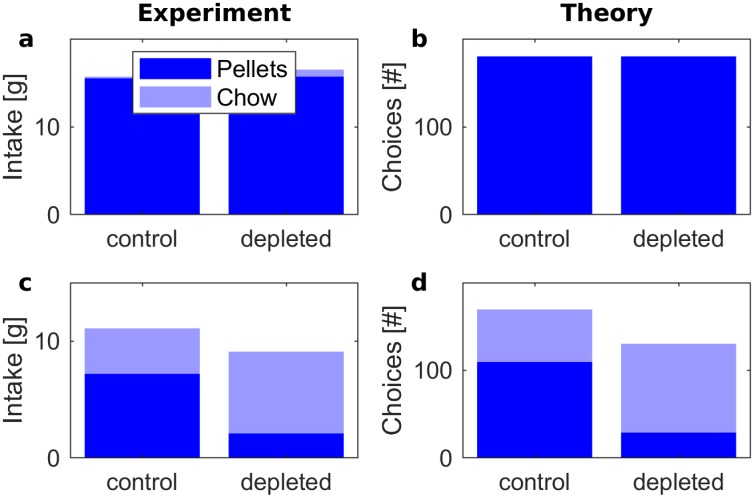
Fig 8. Frequency of choosing pellets (dark blue) and lab chow (light blue) in control and D2-blocked states.
The top displays (a) and (b) correspond to a condition with free pellets, while the bottom displays (c) and (d) correspond to a condition where pressing a lever was required to obtain a pellet. The left displays (a) and (c) re-plot experimental data. The values in (a) were taken from Figure 1 in the paper by Salamone et al. [22]: pellet consumption was 15.5g and 15.7g in control and D2-blocked state, while chow consumption was 0.2g and 0.8g respectively. The values in (c) were taken from Figure 4 in [22]: pellet consumption was 7.2g and 2.1g in control and D2-blocked state, while chow consumption was 3.9g and 7g respectively. The right displays (b) and (d) show the results of simulations. The parameters used to simulate learning were α = 0.1, ϵ = 0.6327 and λ = 0.0204.

