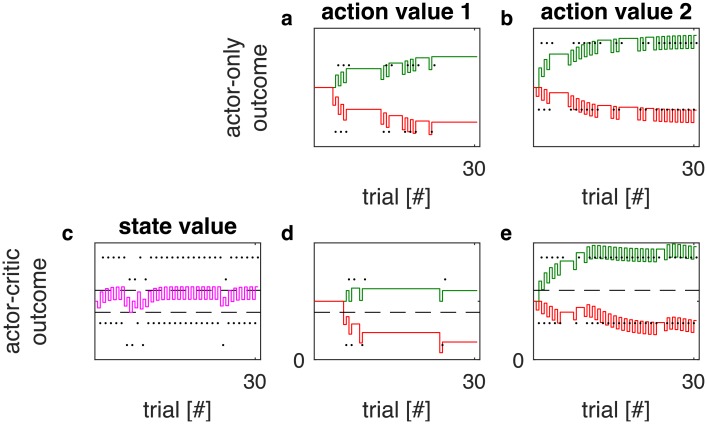
Fig 9. Actor-only in comparison with actor-critic learning.
The columns labeled with ‘action value 1’ (panels a and d) and ‘action value 2’ (panels b and d) show the simulated evolution of the collective synaptic weights G and N of the actor network over 30 successive trials. The first row (panels a and b) shows the evolution of the actor network in an actor-only architecture, while the second row (panels d and e) provides the evolution of the actor in an actor-critic architecture. The weights G are drawn as solid green lines, the negative weights-N are drawn as solid red lines. The reinforcements obtained by choosing the respective actions are indicated by black dots. For the actor-critic simulations (second row), we additionally provide the evolution of the state value in panel c. There, the state value Vcritic is represented by a solid purple line. The expected reinforcements of both actions are indicated by dashed horizontal lines. The parameter settings used in these simulations were α = 0.4, ϵ = 0.519, λ = 0.1013 and β = 0.9. The same set of parameters was used for both the actor-only and the actor-critic model.

