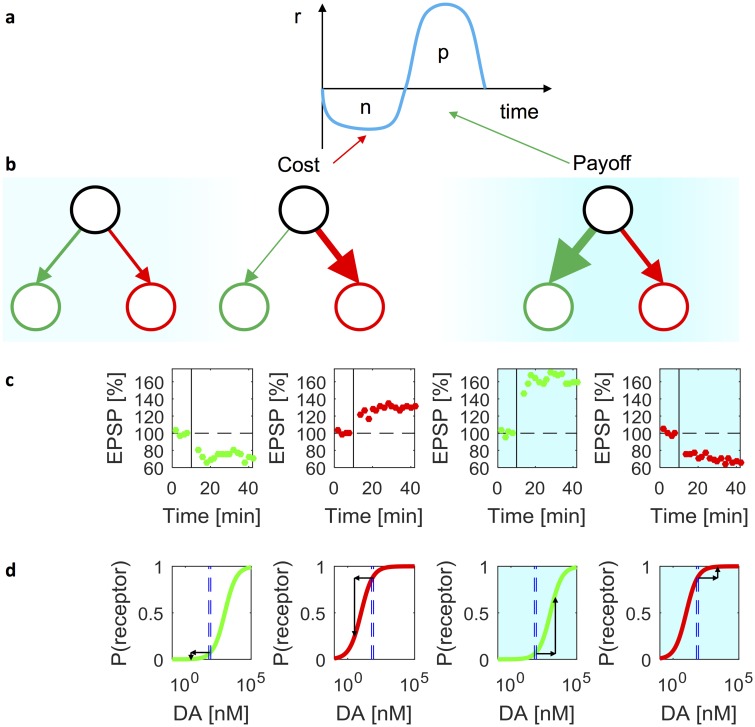
Fig 10. Relationship of learning rules to synaptic plasticity and receptor properties.
(a) Instantaneous reinforcement r when an action with effort n is selected to obtain payoff p. (b) Cortico-striatal weights before the action, after performing the action, and after obtaining the payoff. Red and green circles correspond to striatal Go and No-Go neurons, and the thickness of the lines indicates the strength of synaptic connections. The intensity of the blue background indicates the dopaminergic teaching signal at different moments of time. (c) The average excitatory post-synaptic potential (EPSP) in striatal neurons produced by cortical stimulation as a function of time in the experiment reported in [11]. The vertical black lines indicate the time when synaptic plasticity was induced by successive stimulation of cortical and striatal neurons. The amplitude of EPSPs is normalized to the baseline before the stimulation indicated by horizontal dashed lines. The green and red dots indicate the EPSPs of Go and No-Go neurons respectively. Displays with white background show the data from experiments with rat models of Parkinson’s disease, while the displays with blue background show the data from experiments in the presence of corresponding dopamine receptor agonists. The four displays re-plot the data from Figures 3E, 3B, 3F and 1H in [11]. (d) Changes in dopamine receptor occupancy. The green and red curves show the probabilities of D1 and D2 receptor occupancies in a biophysical model [30]. The two dashed blue lines in each panel indicate the levels of dopamine in dorsal (60 nM) and ventral (85 nM) striatum estimated on the basis of spontaneous firing of dopaminergic neurons using the biophysical model [32]. Displays with white and blue backgrounds illustrate changes in receptor occupancy when the level of dopamine is reduced or increased respectively.

