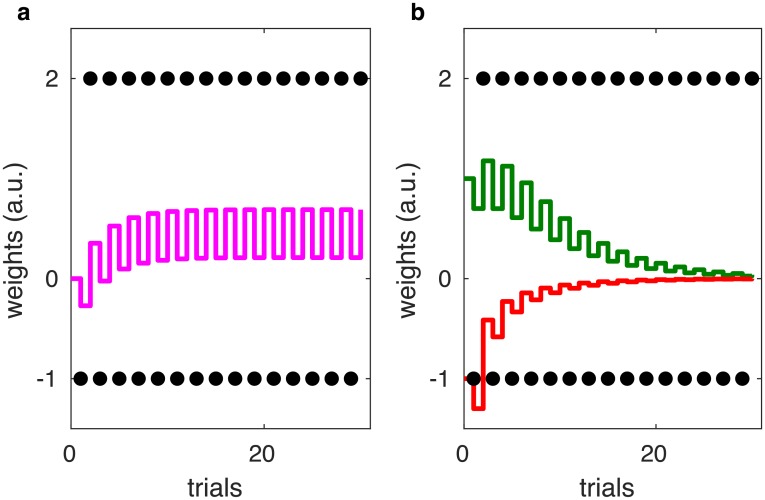
Fig 11. Changes in the weight G of the Go neurons, N of the No-Go neurons and V of the critic in the OpAL model over the course of simulations.
(a) The purple line represents the evolving critic weight. The experienced reinforcements are indicated by black dots. (b) The actor weights, represented by a green and a red line respectively, were initialized to G = N = 1. Again, the black dots indicate the received reinforcements. The simulation was run with learning rate α = 0.3.

