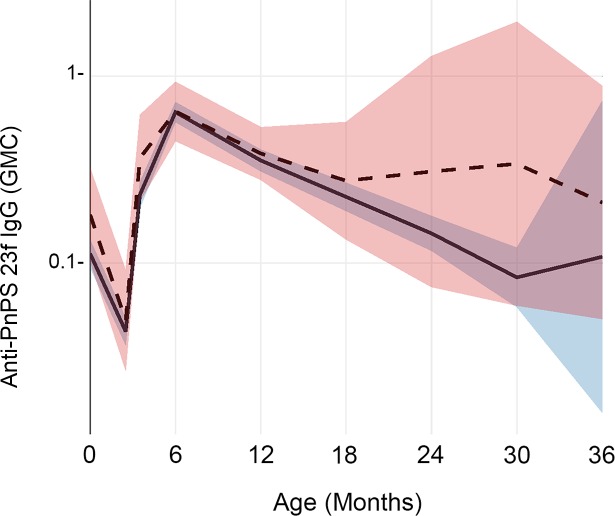
Fig 2. Longitudinal impact of prenatal maternal parasitic infection on infant IgG levels to pneumococcal polysaccharide 23F.
This graph shows geometric mean anti-PnPs 23F serum IgG antibody concentrations (in ug/mL) at birth and over the first 36 months of life. The trajectory for children whose mothers had a parasitic infection either during antenatal care or at the time of delivery (infected) is shown by the solid line, with its 95% CI shaded in blue. The trajectory for children whose mothers remained uninfected (uninfected) is shown by the dashed line, with its 95% CI shaded in pink.

